
 Facebook
 X
X
 Pinterest
 Copy Link
Halifax-Dartmouth Real Estate Market Stats: August 2026
By Rob Lough, Broker/Owner | Century 21 Optimum Realty | September 1, 2026
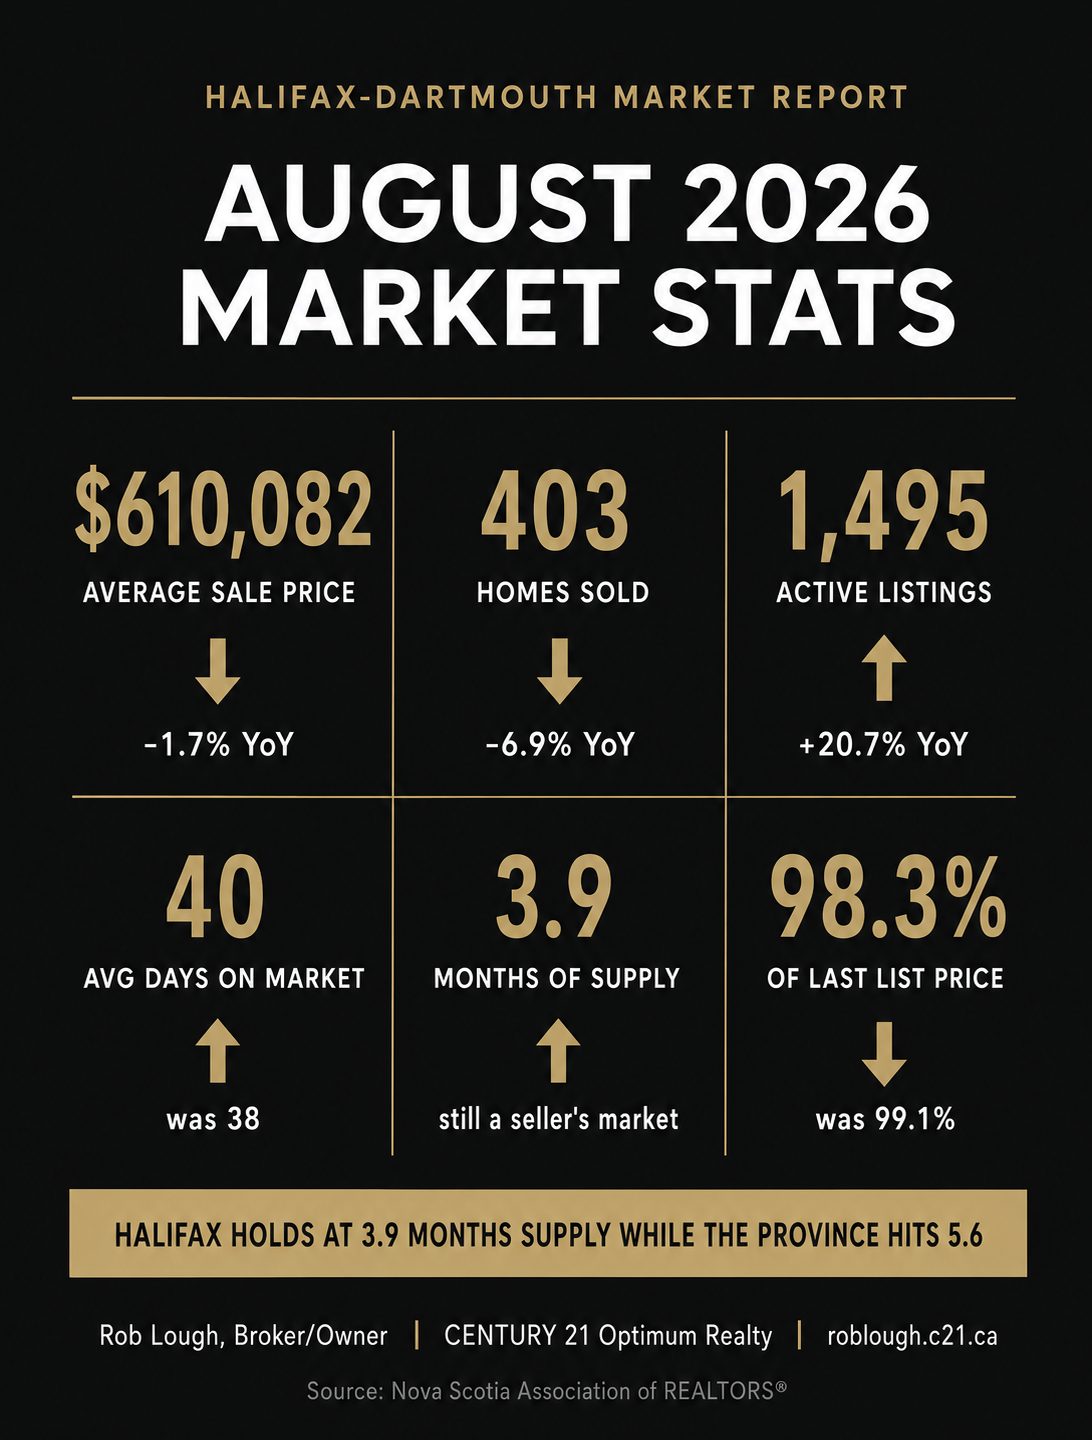
Halifax-Dartmouth spent August doing something the province as a whole did not: holding its ground. While Nova Scotia’s months supply pushed to a 13-month high of 5.6, the Halifax-Dartmouth area held steady at 3.9 months for the second consecutive month, and active inventory actually edged down slightly for the first time since January.
Sales slowed and prices softened at the median, but the underlying tightness that separates this market from the rest of the province is still very much intact.
Here is the full August 2026 picture.
Key Takeaways: Halifax-Dartmouth, August 2026
- 403 homes sold, down 13.3% from July and down 6.9% from August 2025
- Average sales price rose to $610,082, up from $599,299 in July
- Median price held flat at $550,000, down 2.7% year over year
- Active inventory of 1,495 homes, up 20.7% year over year but down slightly from July
- Months supply steady at 3.9, well inside seller’s-market territory
- Days on market lengthened to 40, up from 36 in July
- Sellers received 96.5% of original list price, the softest reading since December
Total Units Sold
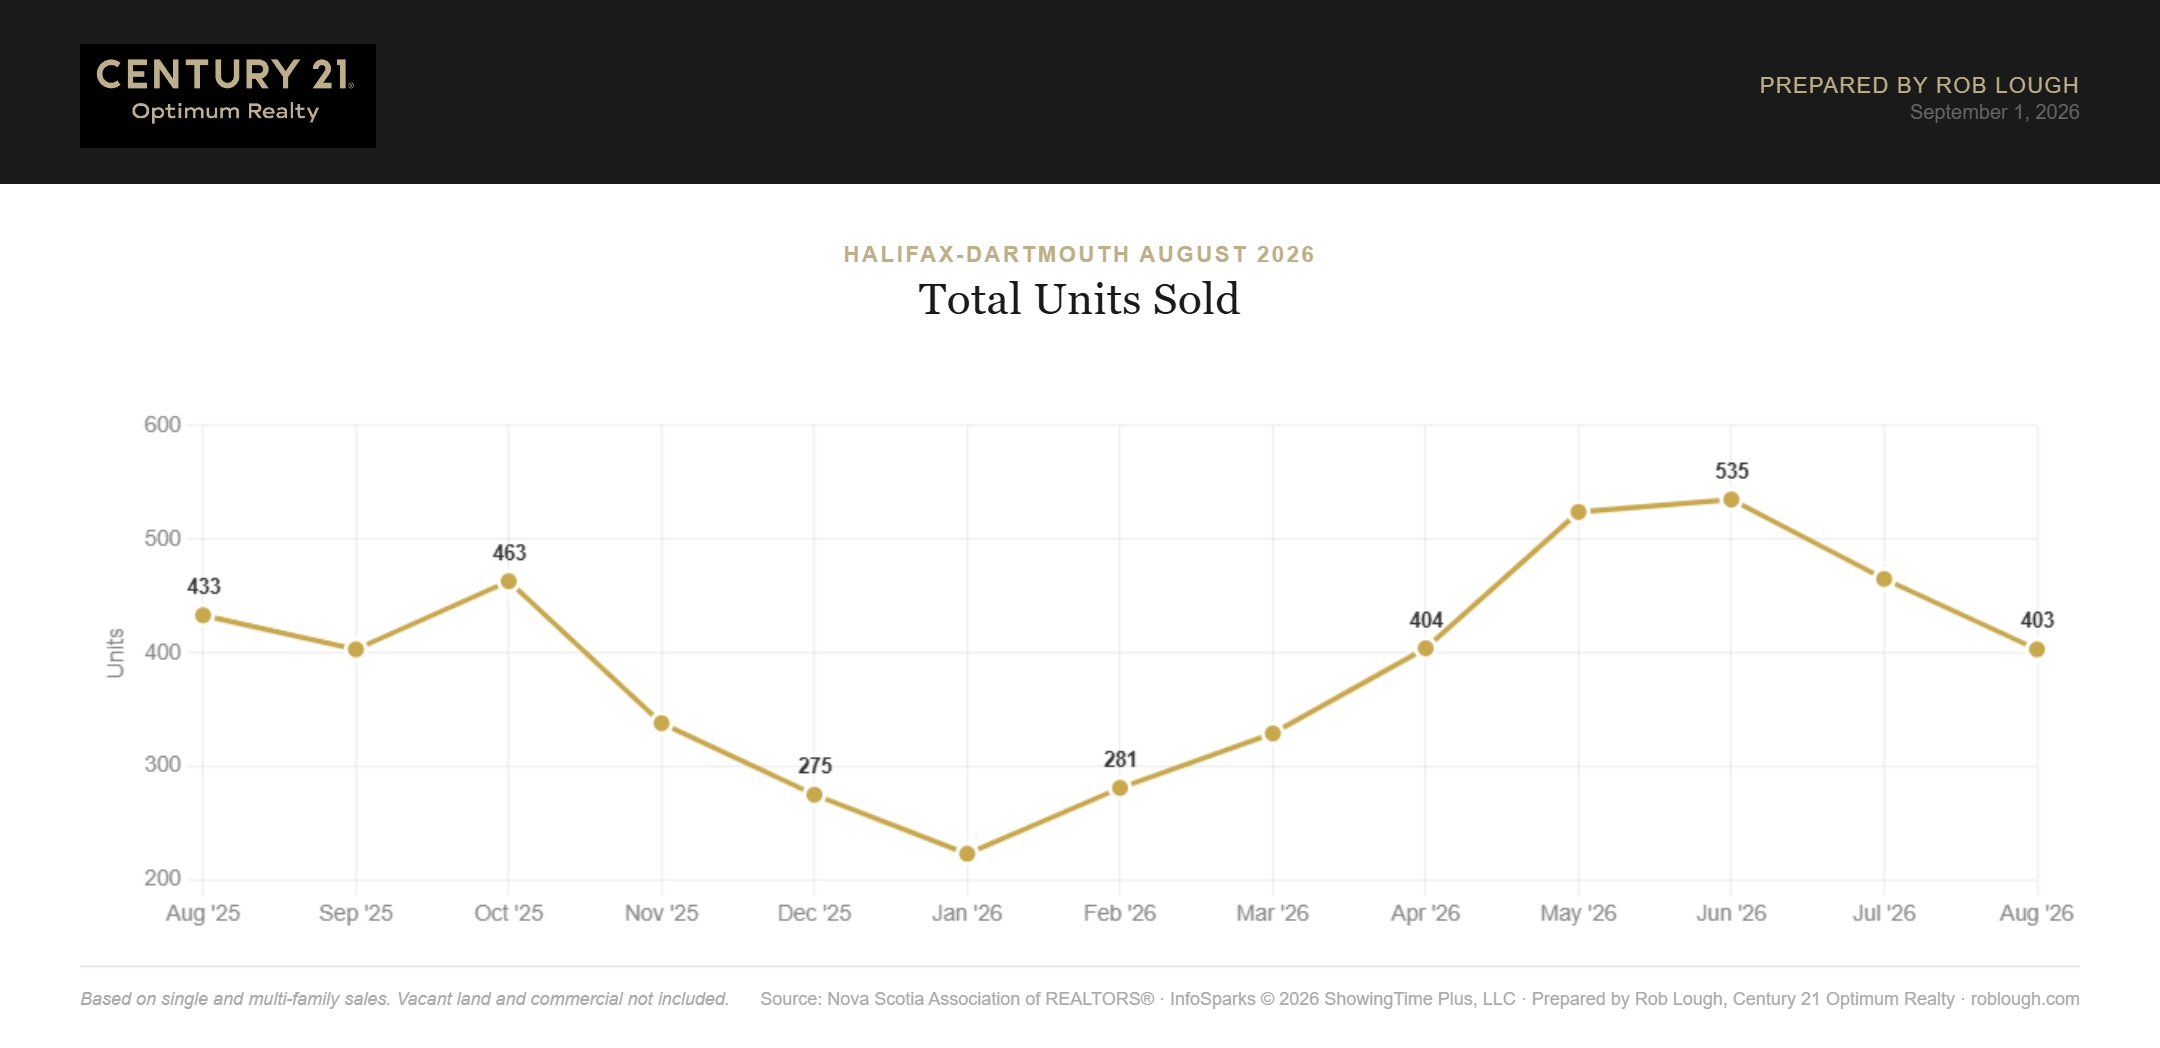
Halifax-Dartmouth Real Estate Market Stats August 2026 Total number of units sold
Sales totalled 403 in August, down from 465 in July and 433 in August 2025, a decline of 6.9% year over year. That is the slowest August in the trailing 13-month series and a clear step down from the 535-sale June peak.
Pending sales came in at 382, down from 425 in July, which suggests September closings will land in a similar range.
Dollar Volume of Closed Sales
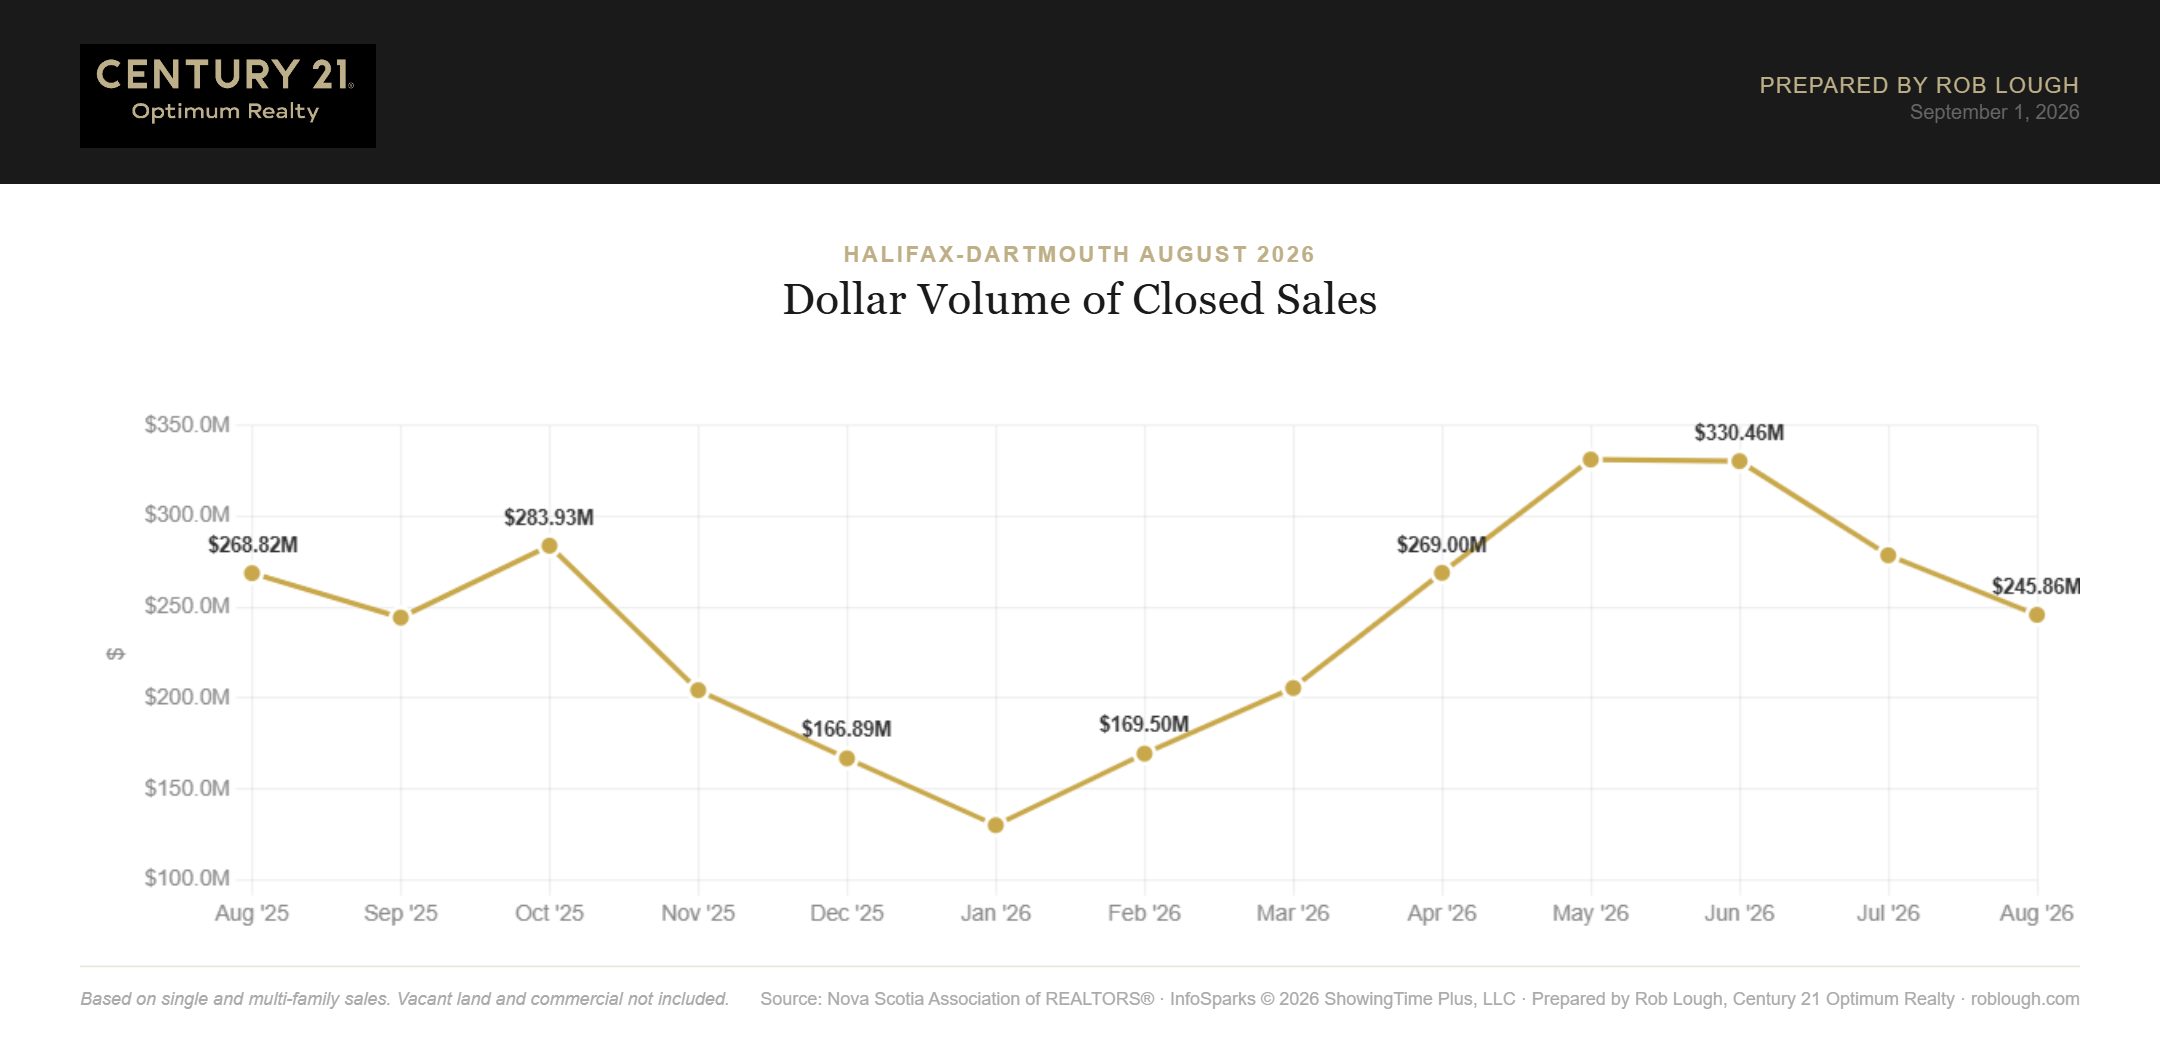
Halifax-Dartmouth Real Estate Market Stats August 2026 dollar volume of closed sales
Dollar volume reached $245.9 million in August, down from $278.7 million in July and down 8.5% from $268.8 million a year ago.
Volume fell faster than unit count because the median transaction was smaller. That is a mix effect, not a valuation problem, as the next two sections show.
Average Sales Price
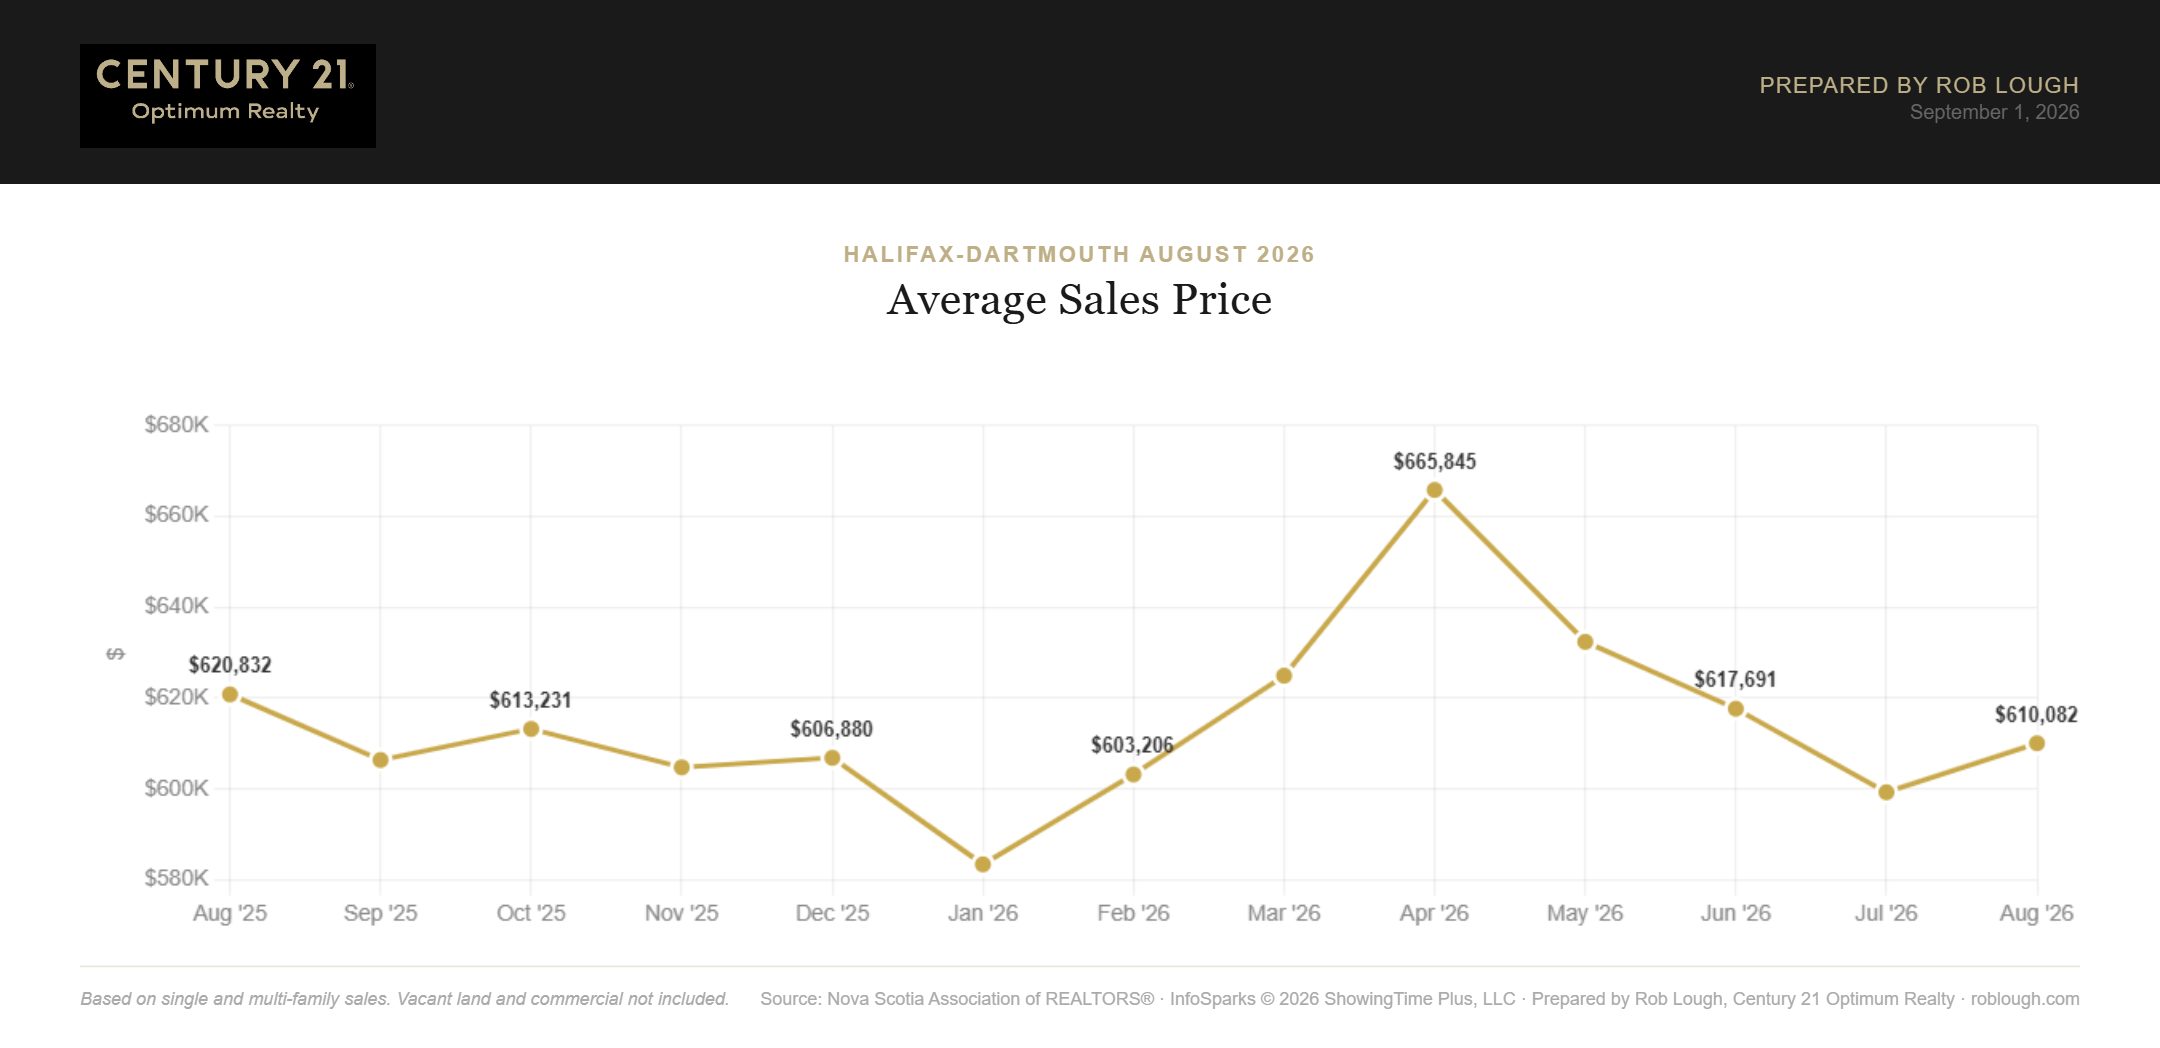
Halifax-Dartmouth Real Estate Market Stats August 2026 average sales price
The average sales price climbed to $610,082 in August, up 1.8% from July’s $599,299 but down 1.7% from $620,832 in August 2025.
Halifax-Dartmouth continues to command roughly $124,000 more than the provincial average of $486,511, a premium that has held remarkably steady all year.
Median Sales Price
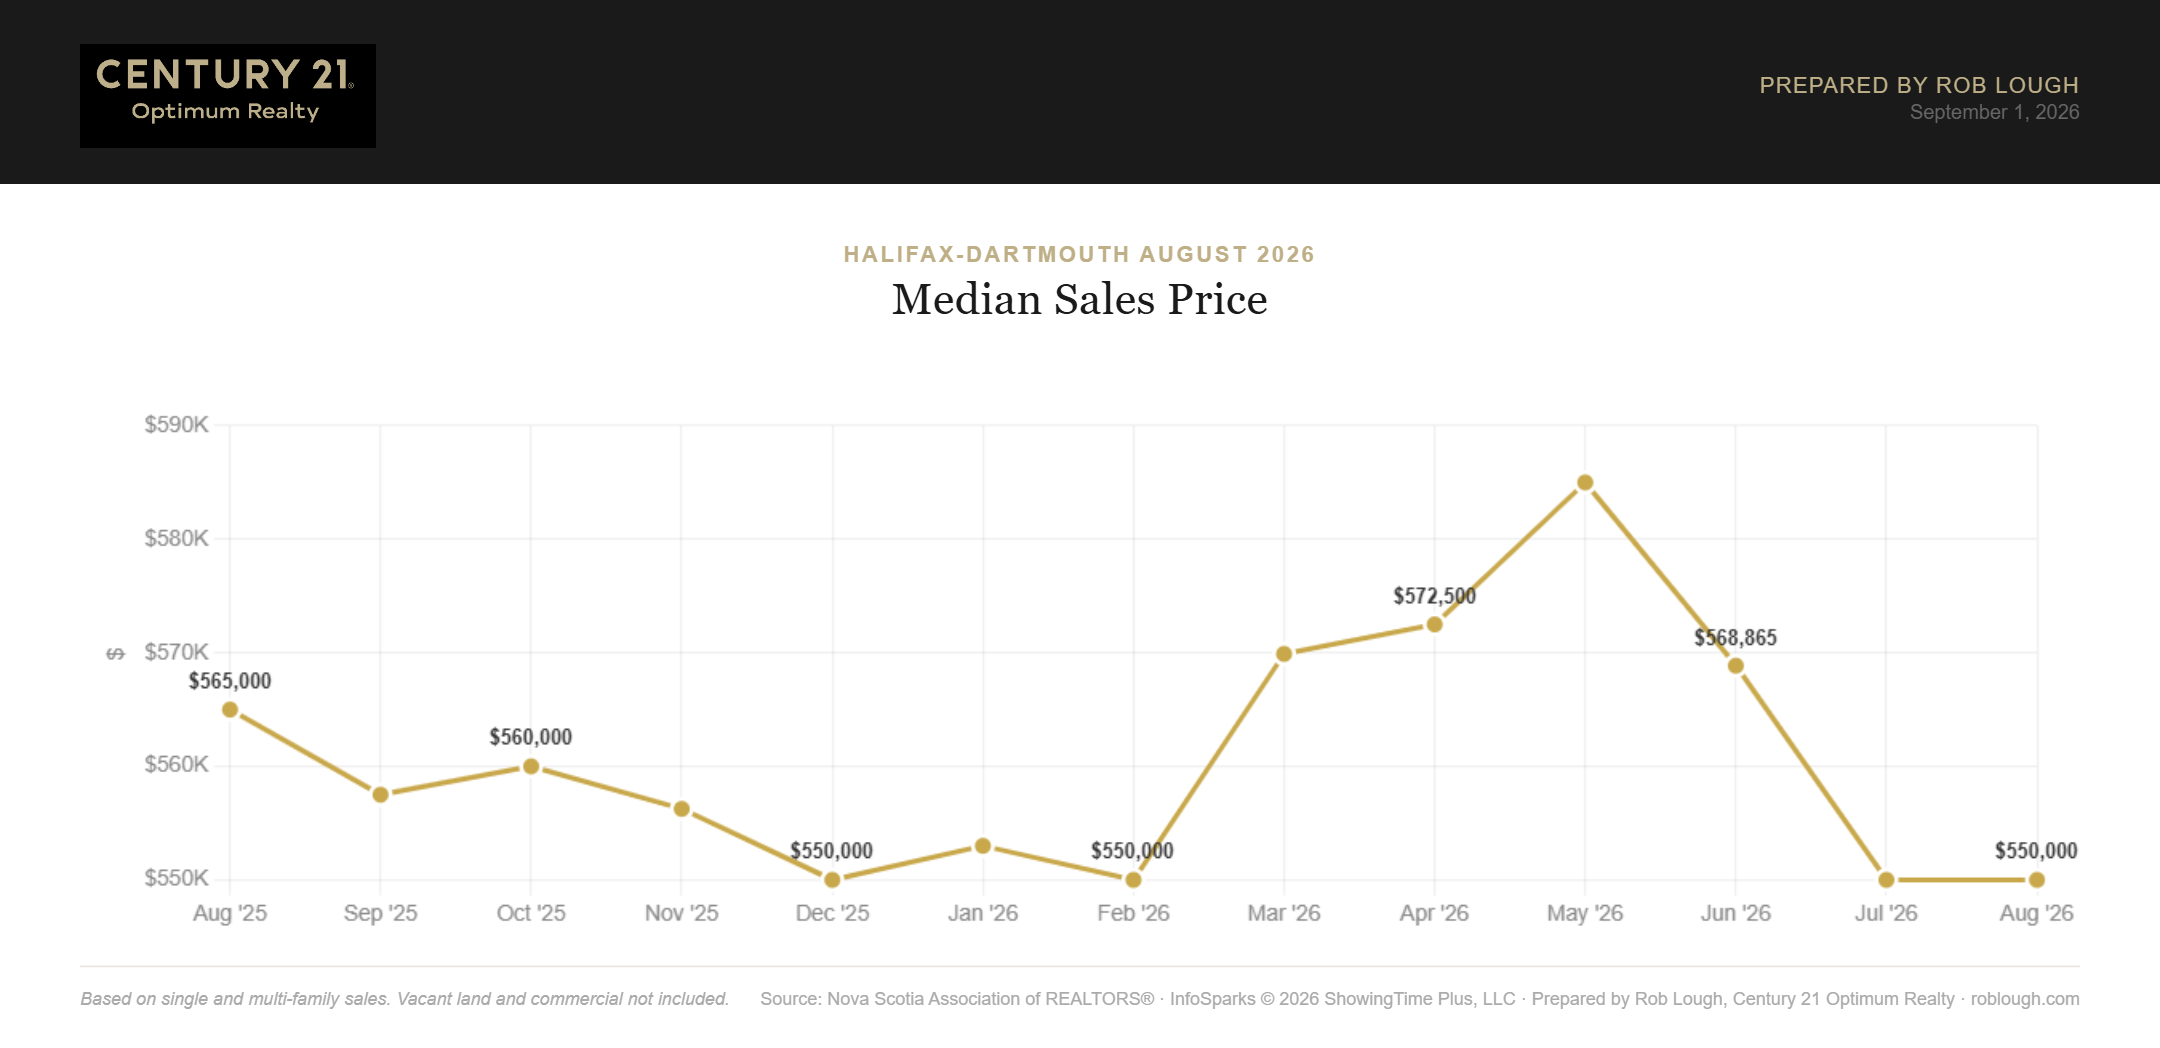
Halifax-Dartmouth Real Estate Market Stats August 2026 median sales price
The median sales price was $550,000 in August, unchanged from July and down 2.7% from $565,000 a year earlier. The median has now printed at or near $550,000 for three of the last four months.
When the average rises while the median stays flat, higher-end properties are carrying more of the volume. Entry-level and mid-market activity has cooled faster than the top of the market.
Average Price Per Square Foot
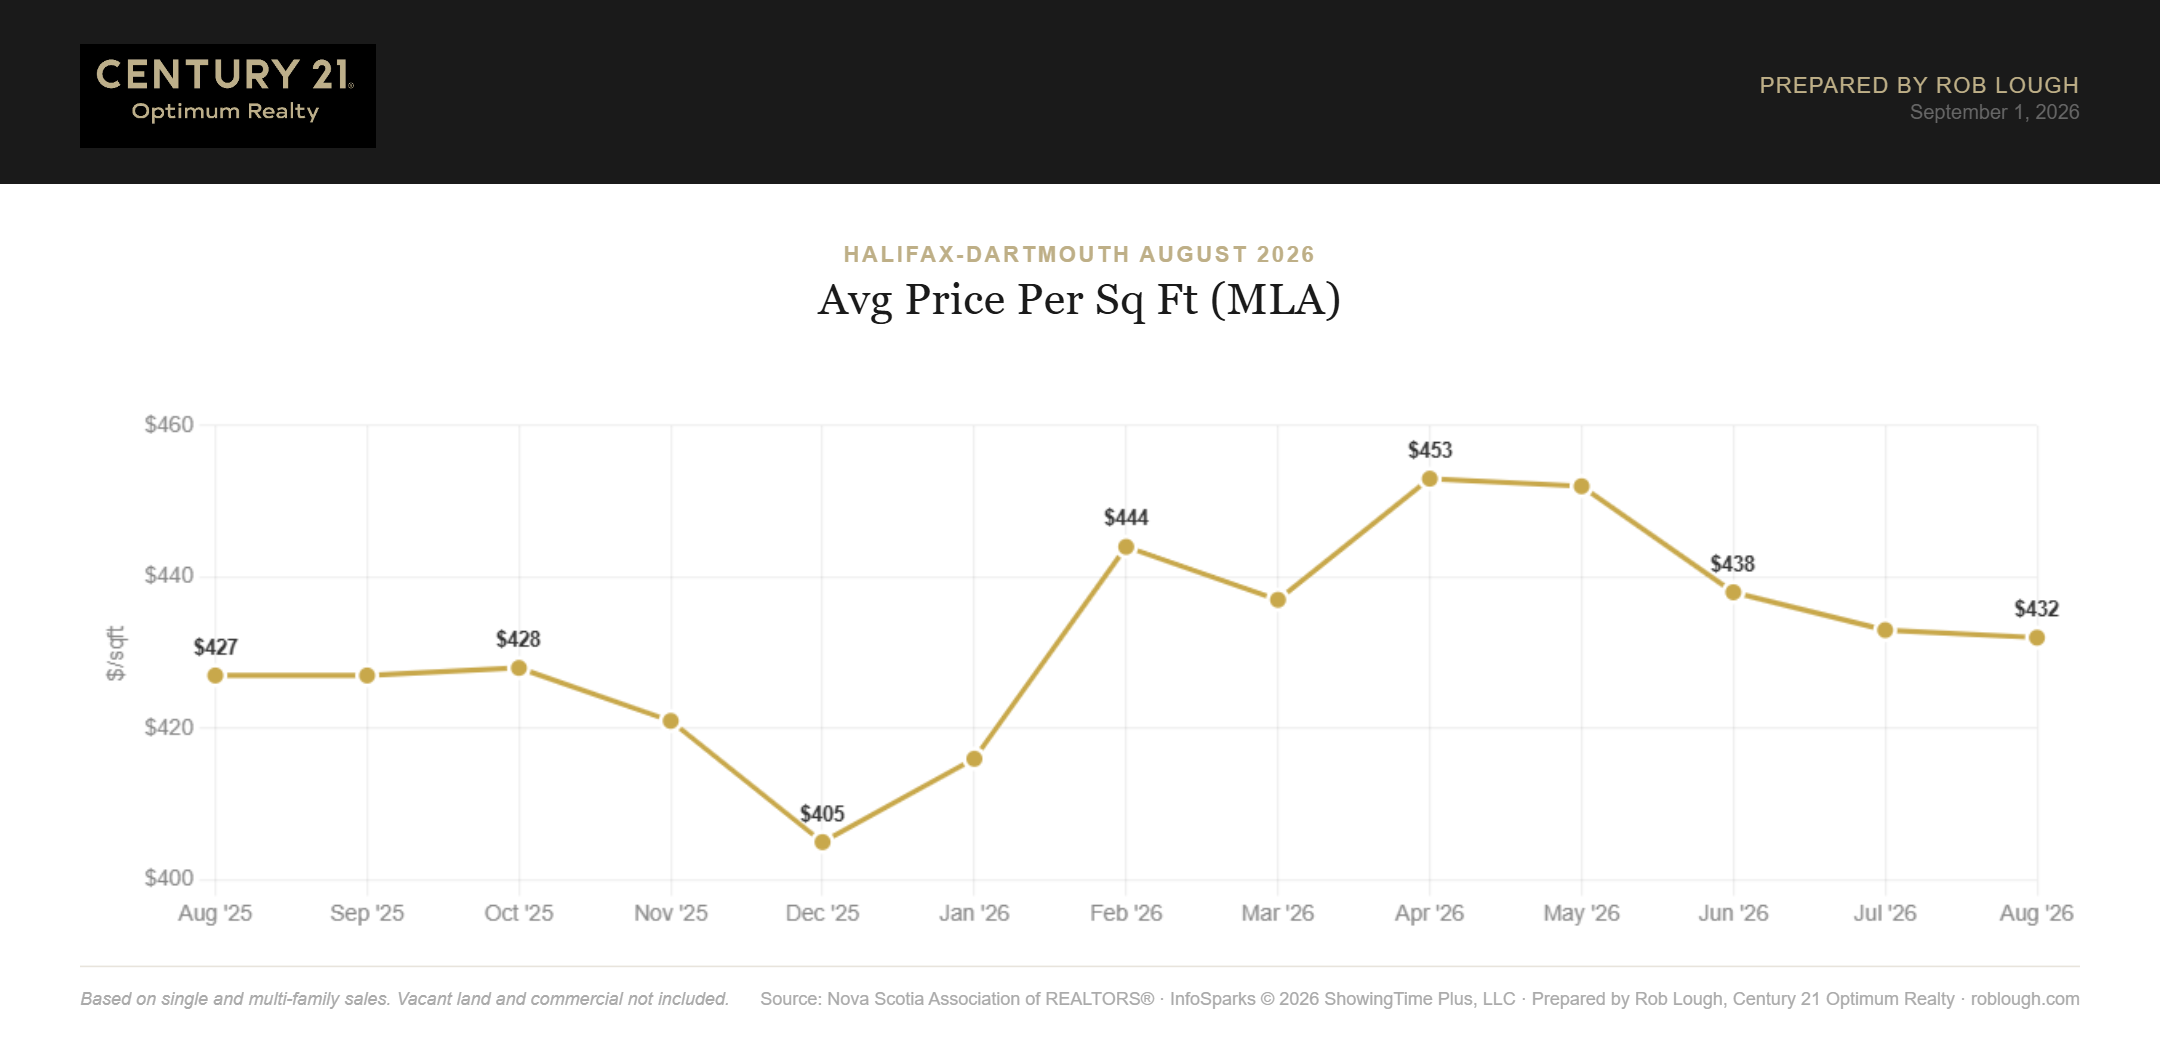
Halifax-Dartmouth Real Estate Market Stats August 2026 average price per sq foot MLA
Price per square foot on total living area was $320 in August, down from $329 in July but up 1.3% from $316 last August. On main living area, the figure was $432, versus $433 in July and $427 a year ago.
This is the metric to watch when headline prices wobble. It strips out changes in the size and type of what sold, and on that basis Halifax-Dartmouth values are still slightly ahead of last year. The softness in the median is a mix story, not a value story.
New Listings
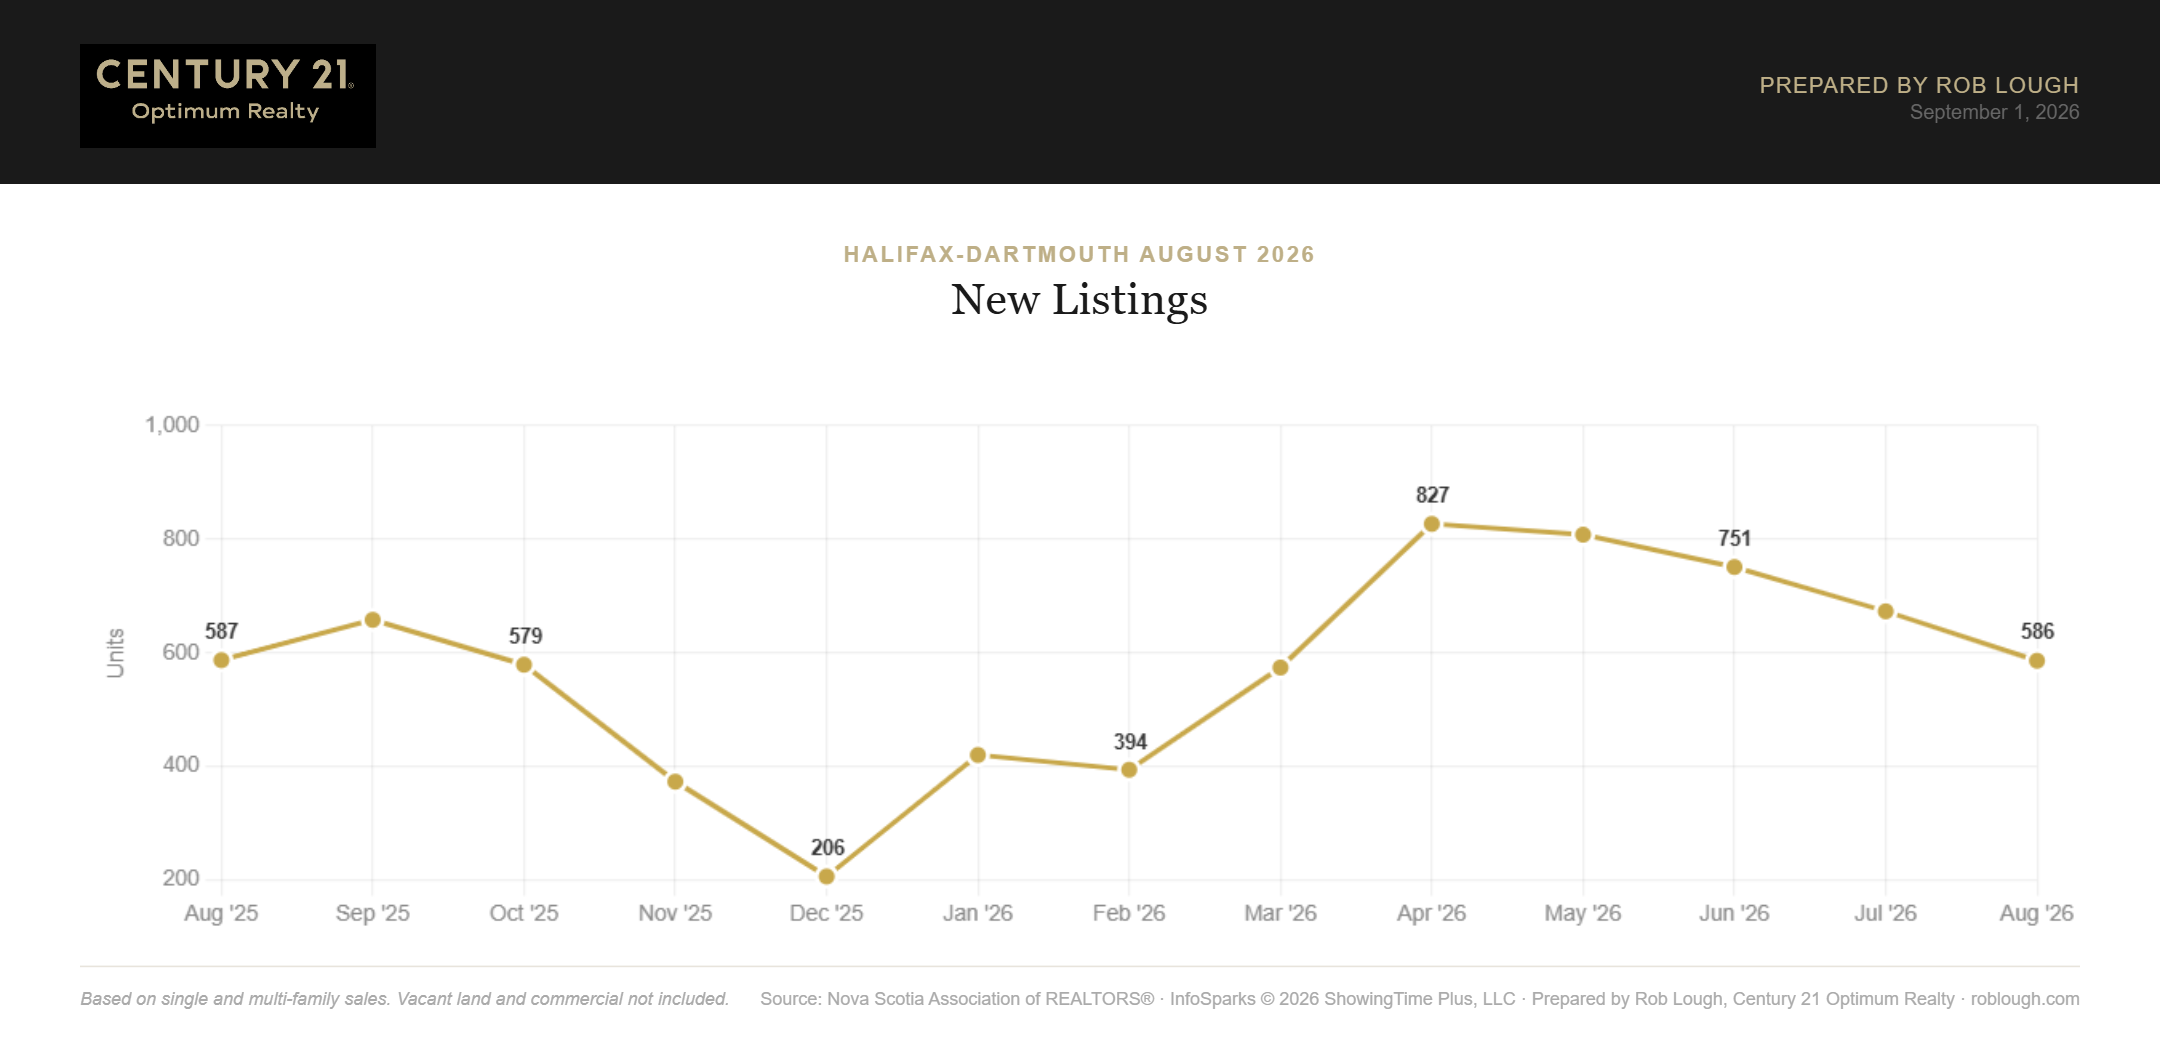
Halifax-Dartmouth Real Estate Market Stats August 2026 number of new listings
New listings totalled 586 in August, down from 673 in July and essentially identical to the 587 recorded in August 2025.
That is the meaningful detail this month. Supply is not flooding in. Sellers are coming to market at the same rate they did a year ago, which is why inventory stopped climbing.
Homes for Sale (Active Inventory)
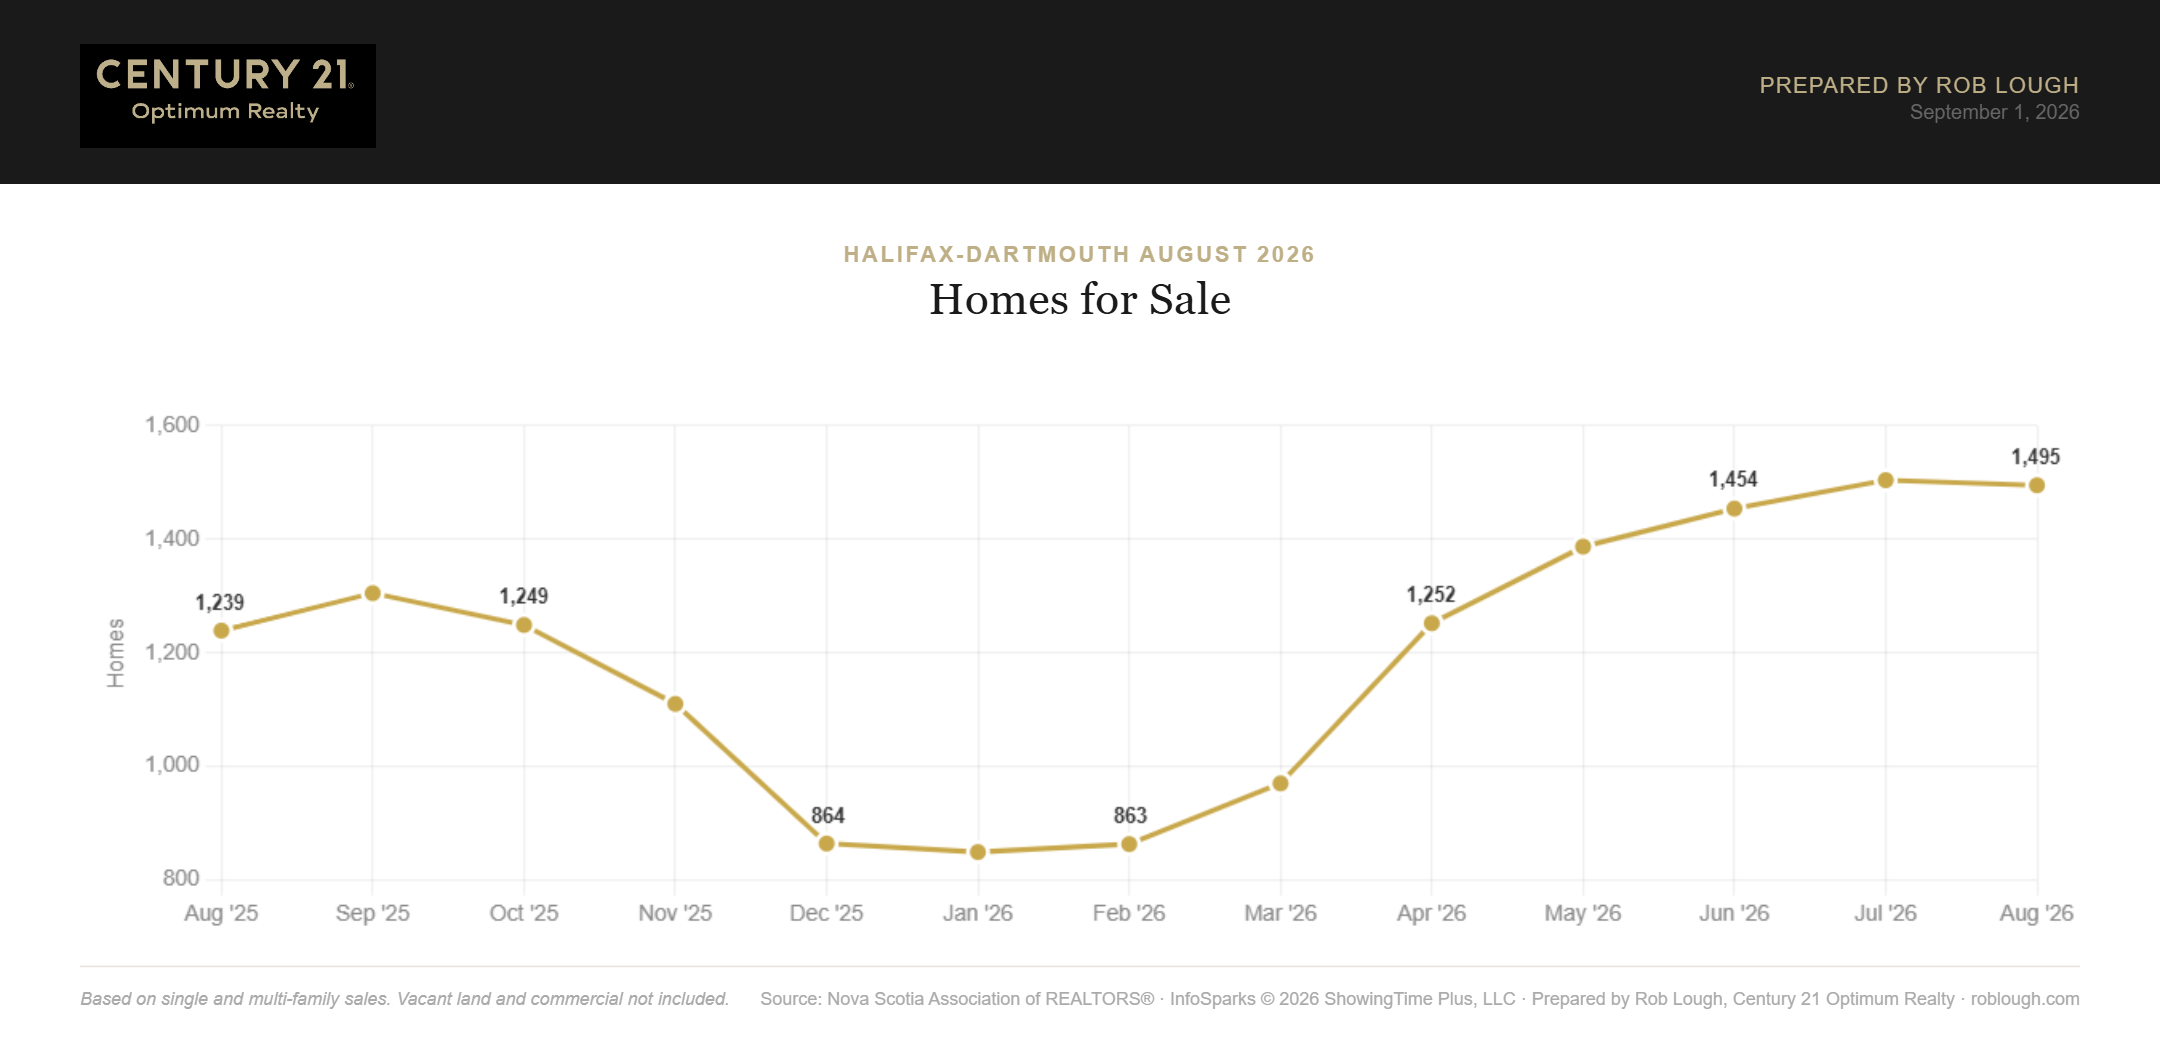
Halifax-Dartmouth Real Estate Market Stats August 2026 number of homes for sale
Active inventory finished August at 1,495 homes, down slightly from 1,504 in July and up 20.7% from 1,239 a year ago.
This is the first month-over-month decline in active inventory since January. Whether that marks a plateau or a seasonal pause will be clearer by October, but after seven straight months of building, it is worth noting.
Months Supply of Homes for Sale
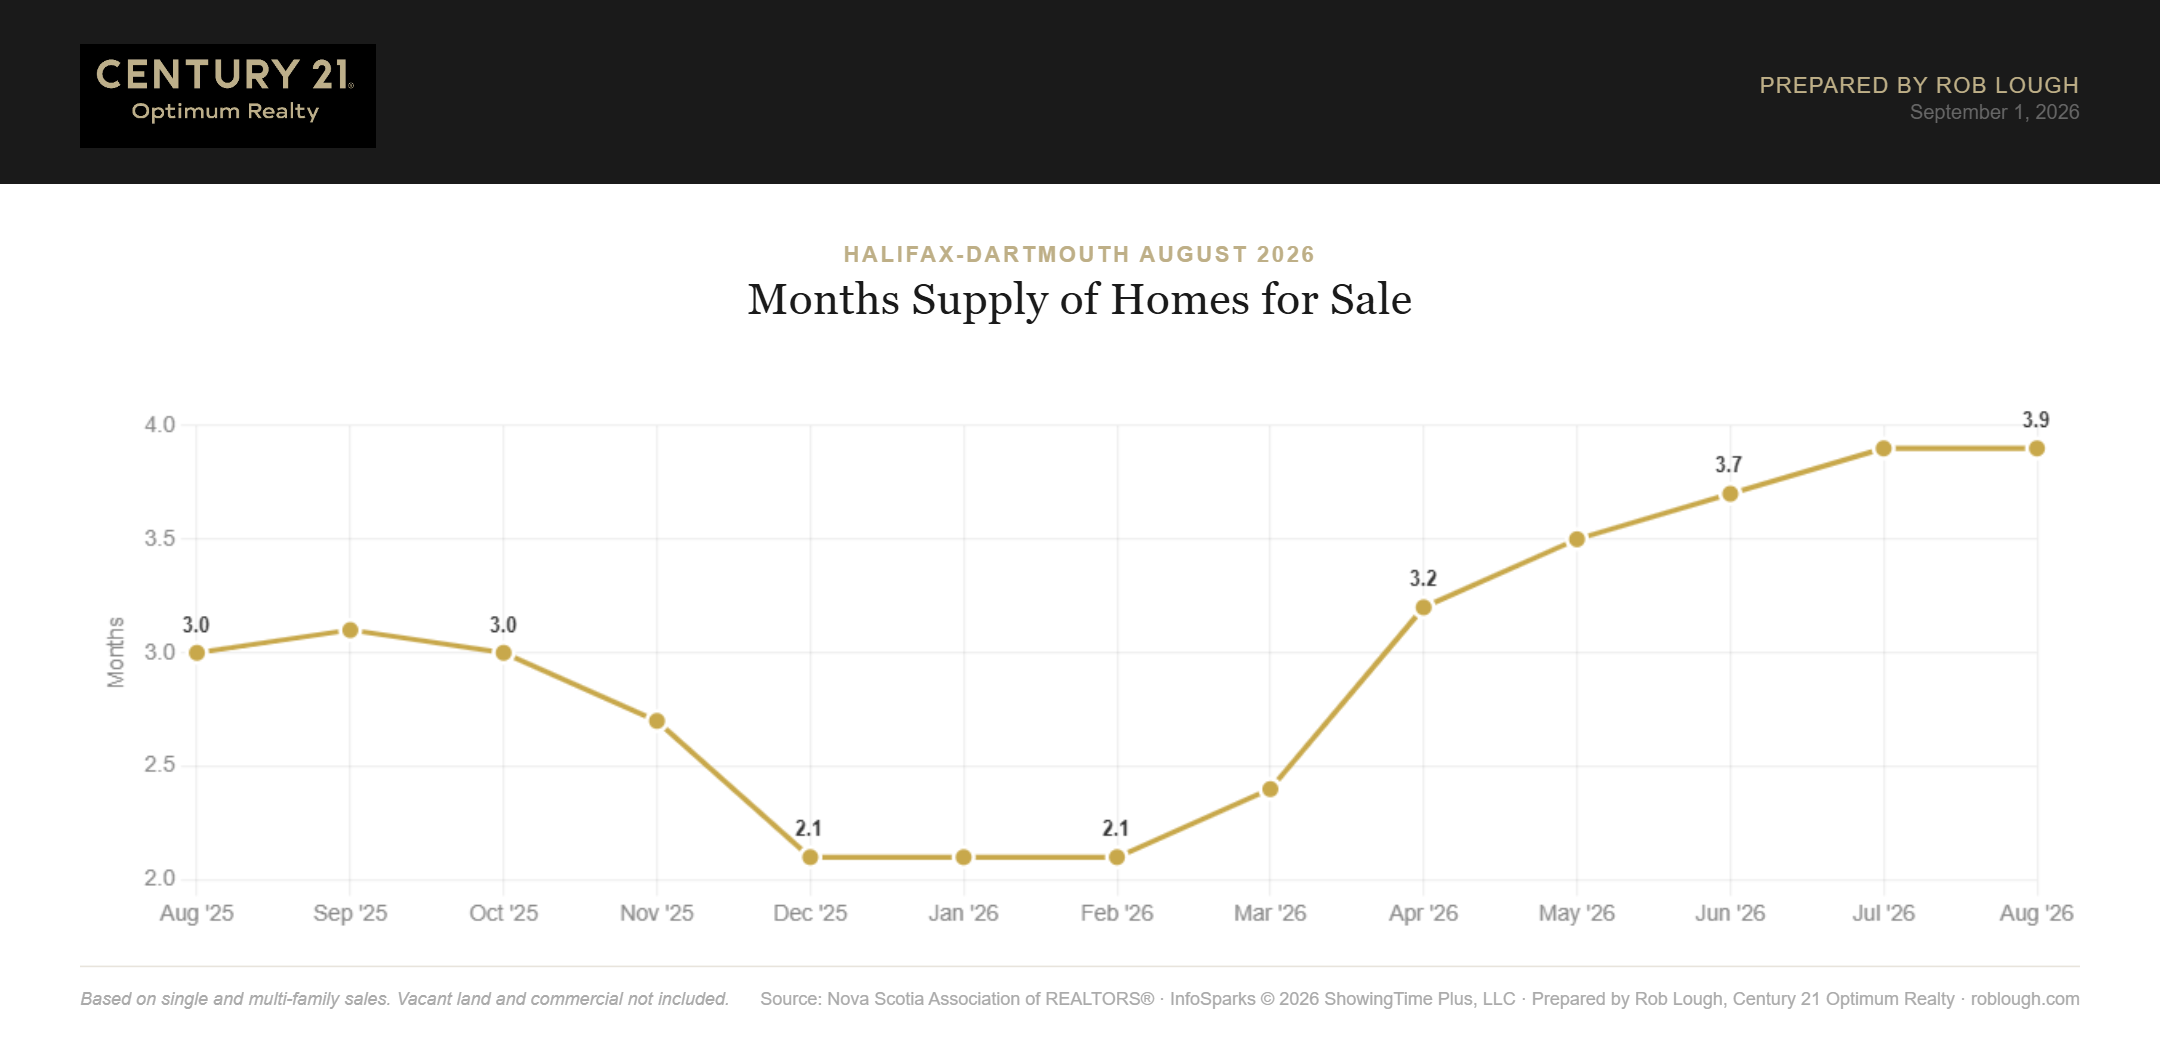
Halifax-Dartmouth Real Estate Market Stats August 2026 number of homes for sale months supply of inventory
Months supply held at 3.9 for the second month running, up from 3.0 in August 2025 but comfortably below the six-month threshold that defines a balanced market.
This is the single biggest divergence between Halifax-Dartmouth and the province. Nova Scotia overall sits at 5.6 months and is drifting toward balance. Halifax-Dartmouth is at 3.9 and has stopped moving. Sellers in the urban core still hold more leverage than provincial headlines would suggest.
Average Days on Market
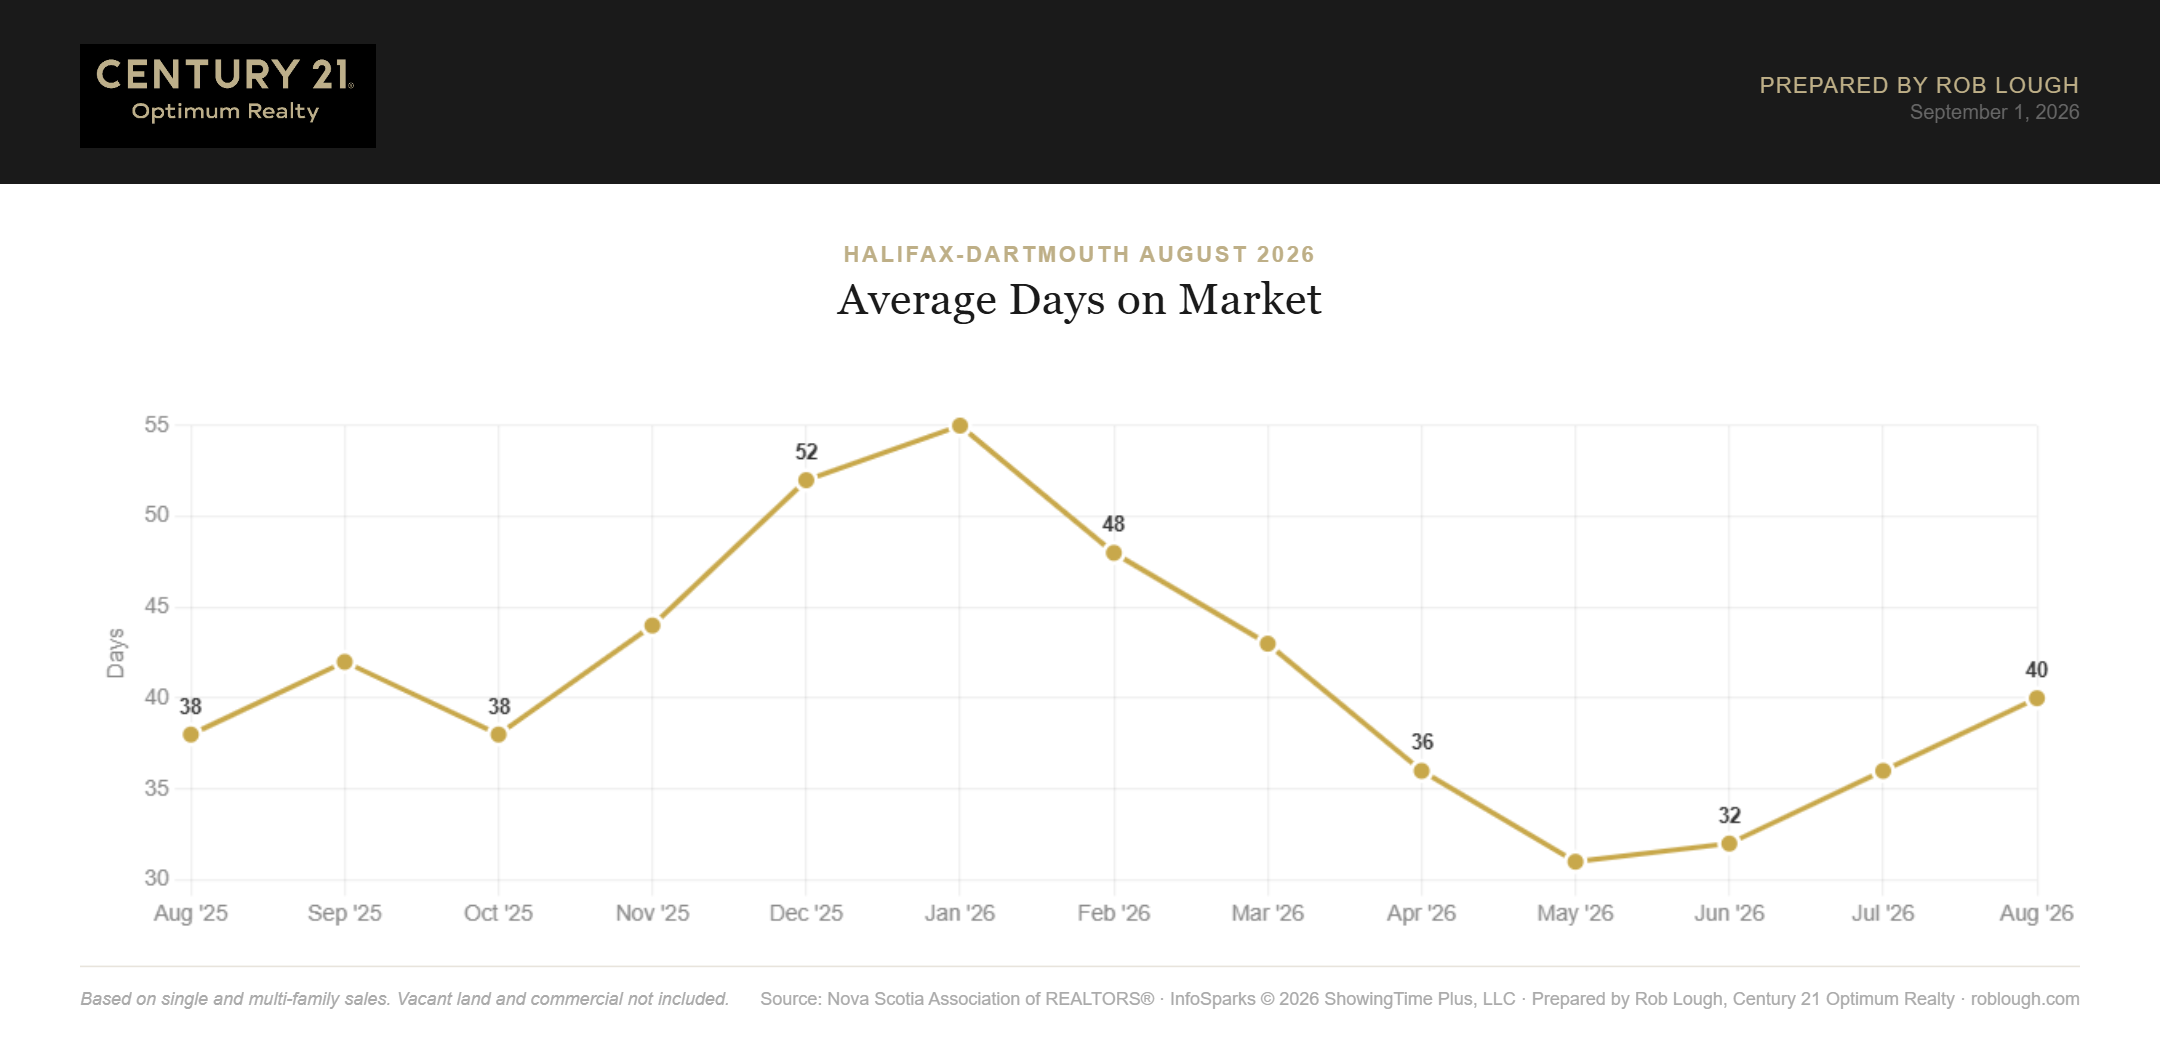
Halifax-Dartmouth Real Estate Market Stats August 2026 average days on market
Homes took an average of 40 days to sell in August, up from 36 in July and 38 a year ago. The market has slowed steadily from the May low of 31 days.
Forty days is still fast. The provincial average is 50. But sellers planning a move should budget six weeks rather than the four they might have counted on in the spring.
Sale-to-Last-List Price Ratio
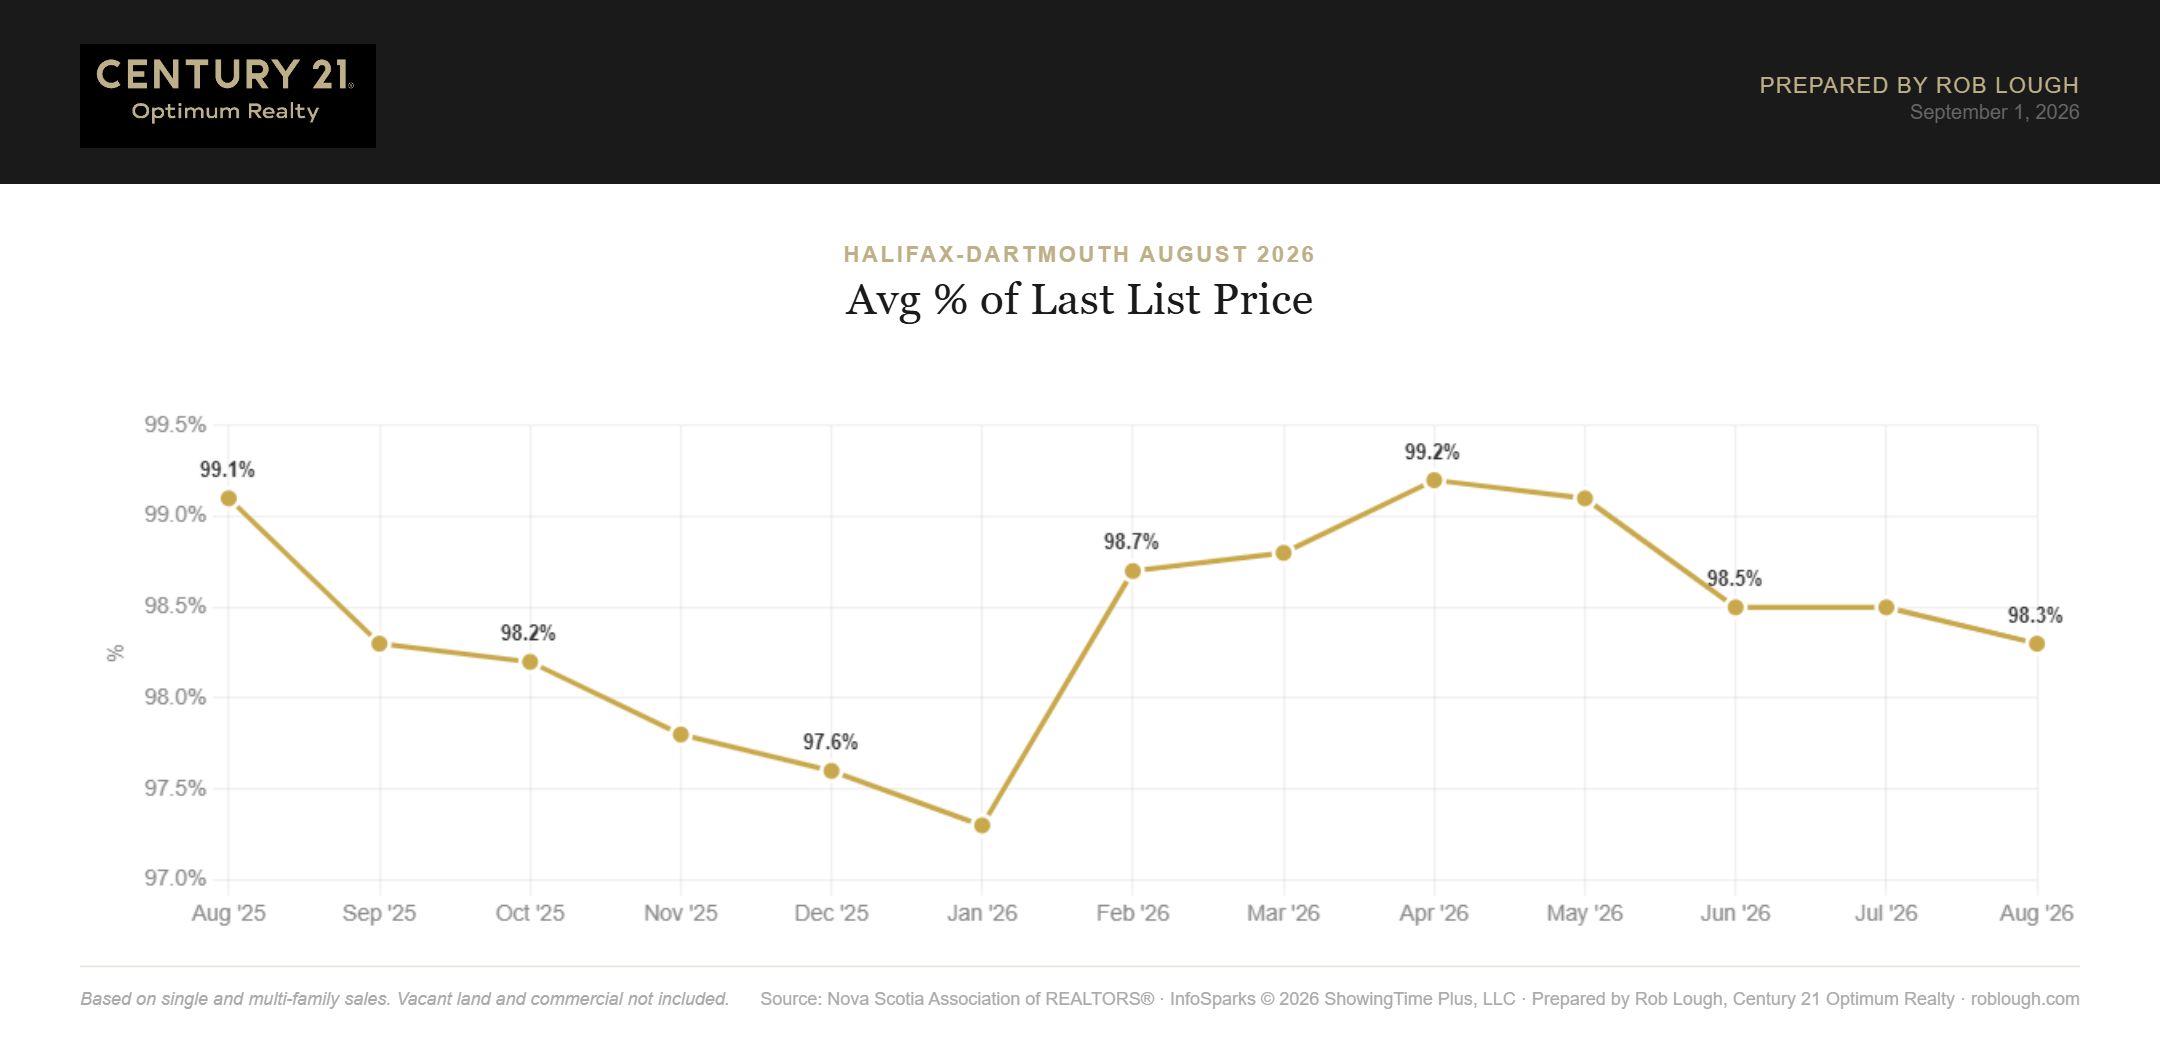
Halifax-Dartmouth Real Estate Market Stats August 2026 average % of last list price
Sellers received 98.3% of their last list price in August, down from 98.5% in July and 99.1% in August 2025.
Still within two points of asking. Correctly priced homes in Halifax-Dartmouth continue to sell close to the number on the sign.
Sale-to-Original-List Price Ratio
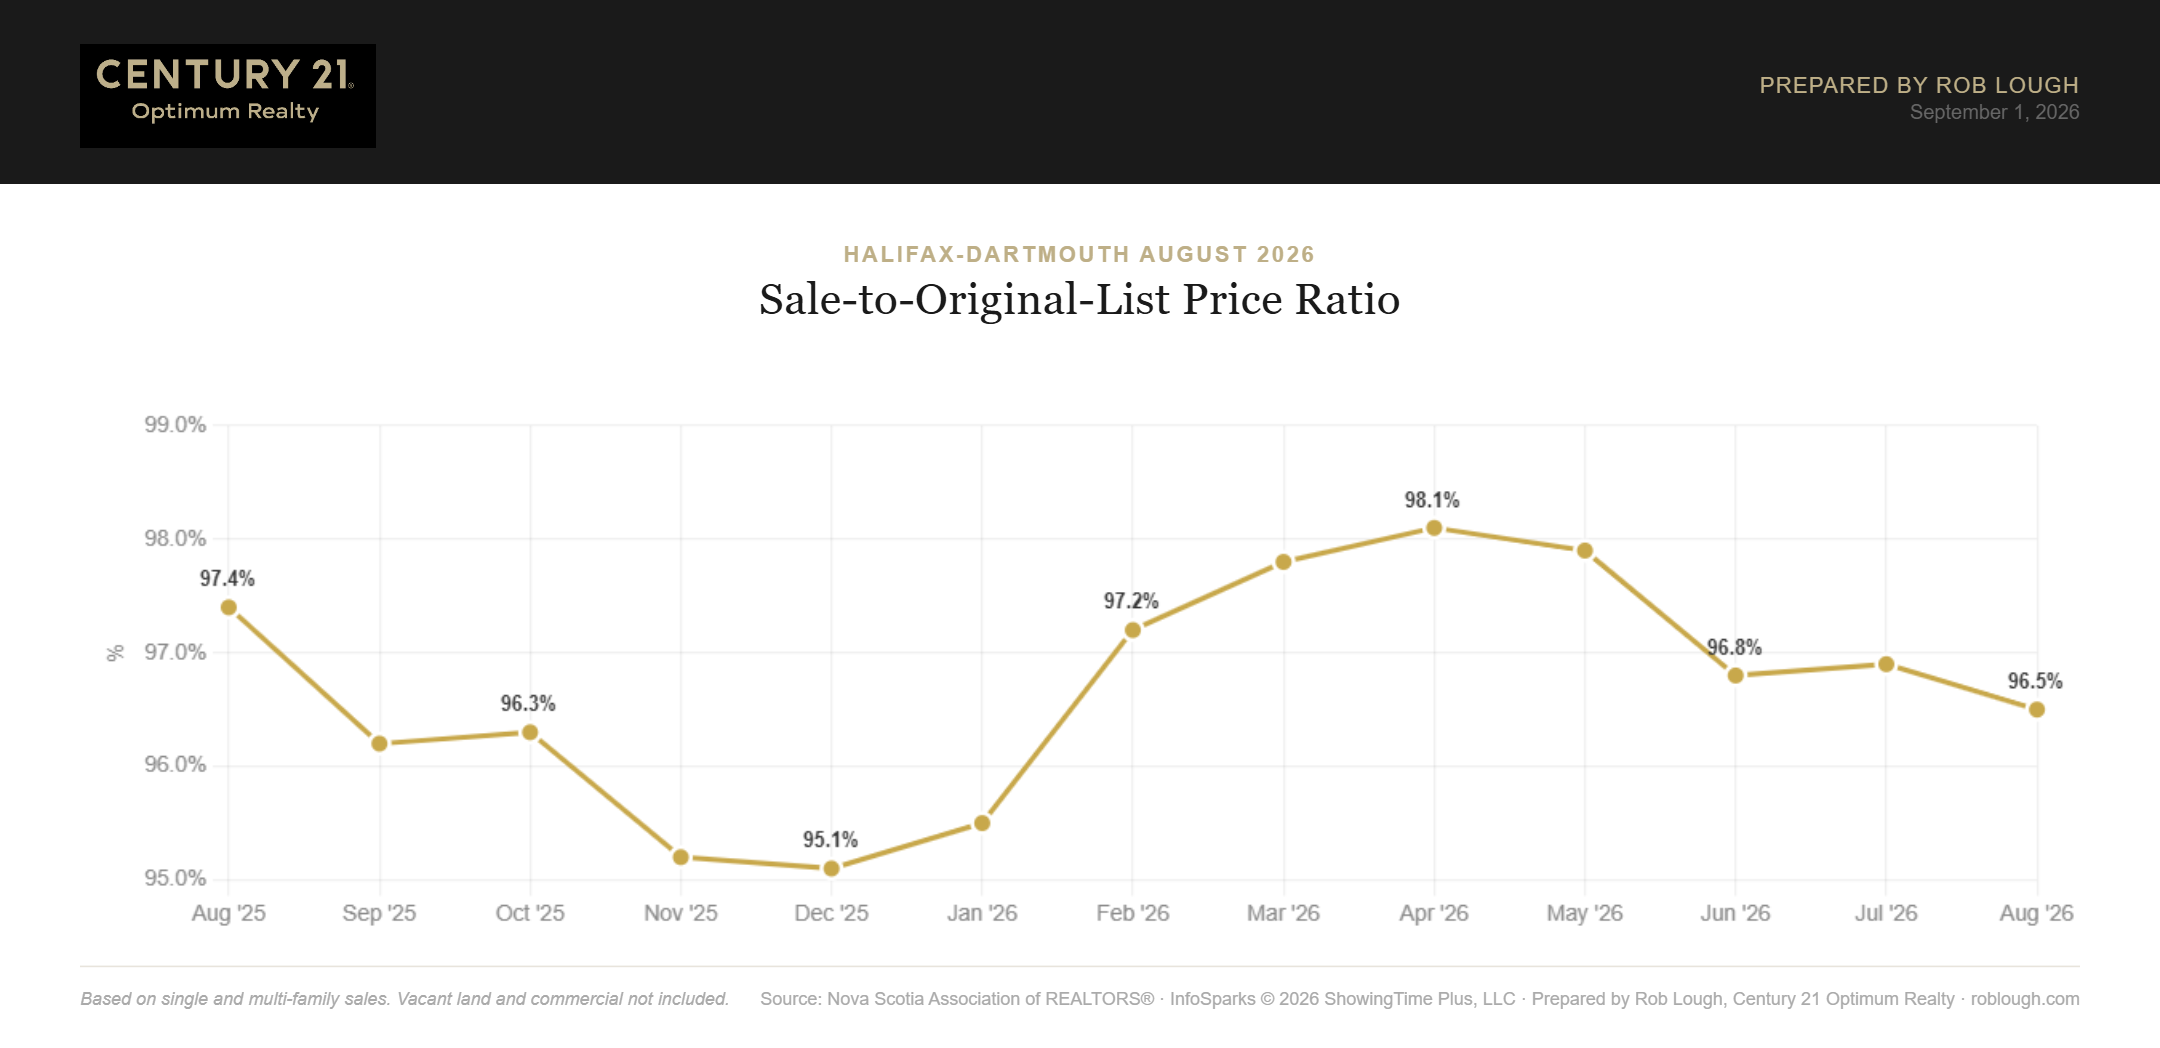
Halifax-Dartmouth Real Estate Market Stats August 2026 average % of original list price
Against the original list price, the ratio was 96.5%, down from 96.9% in July and 97.4% a year ago. This is the softest reading since December 2025.
The 1.8-point spread between the two ratios is what a price reduction costs. On a $600,000 home, that is roughly $11,000 lost to starting too high. Compare that to the provincial spread of 2.5 points and Halifax sellers are still getting off relatively lightly, but the gap has widened every month since May.
Showings Per Listing
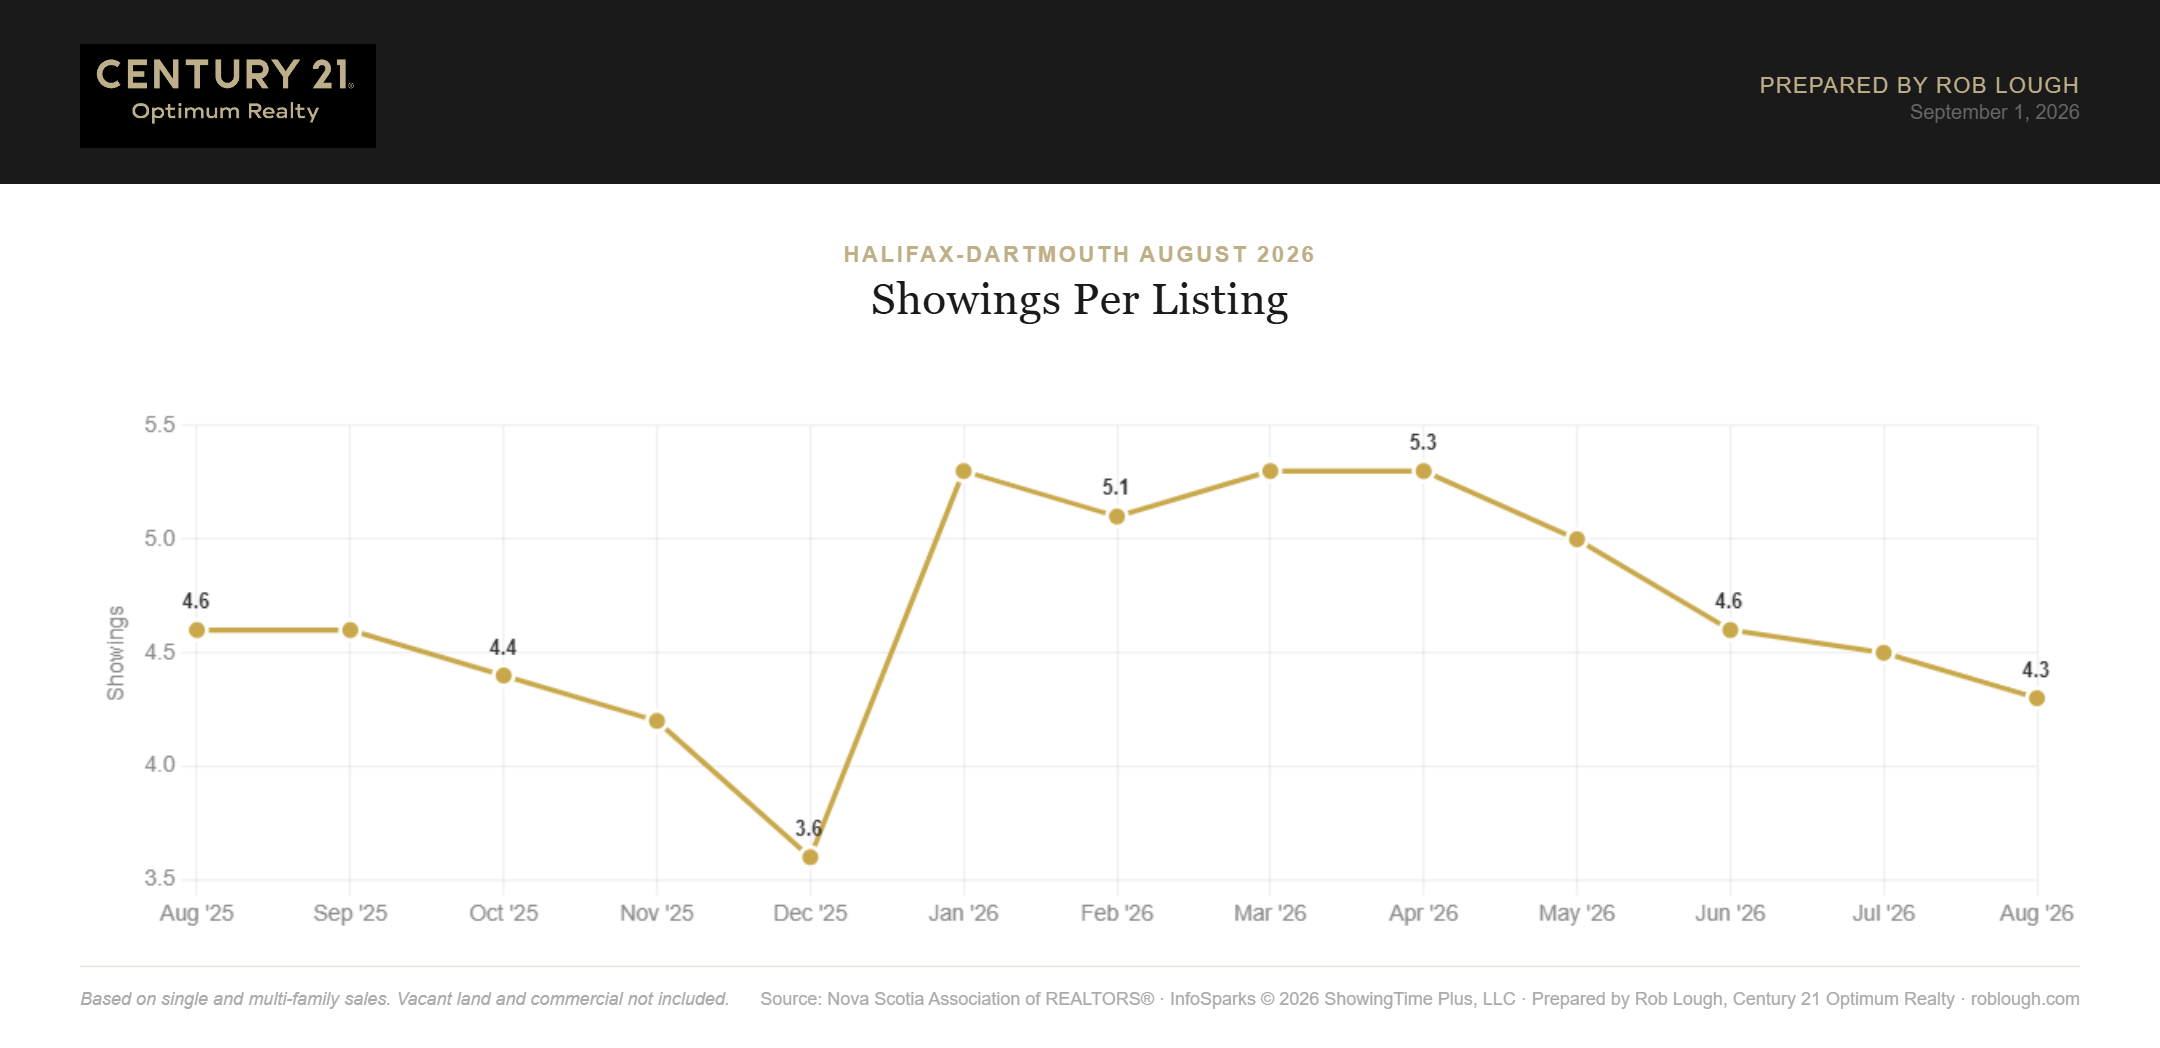
Halifax-Dartmouth Real Estate Market Stats August 2026 number of showings per listing
Showings per listing eased to 4.3 in August, down from 4.5 in July and 4.6 a year ago. That is the lowest reading since December.
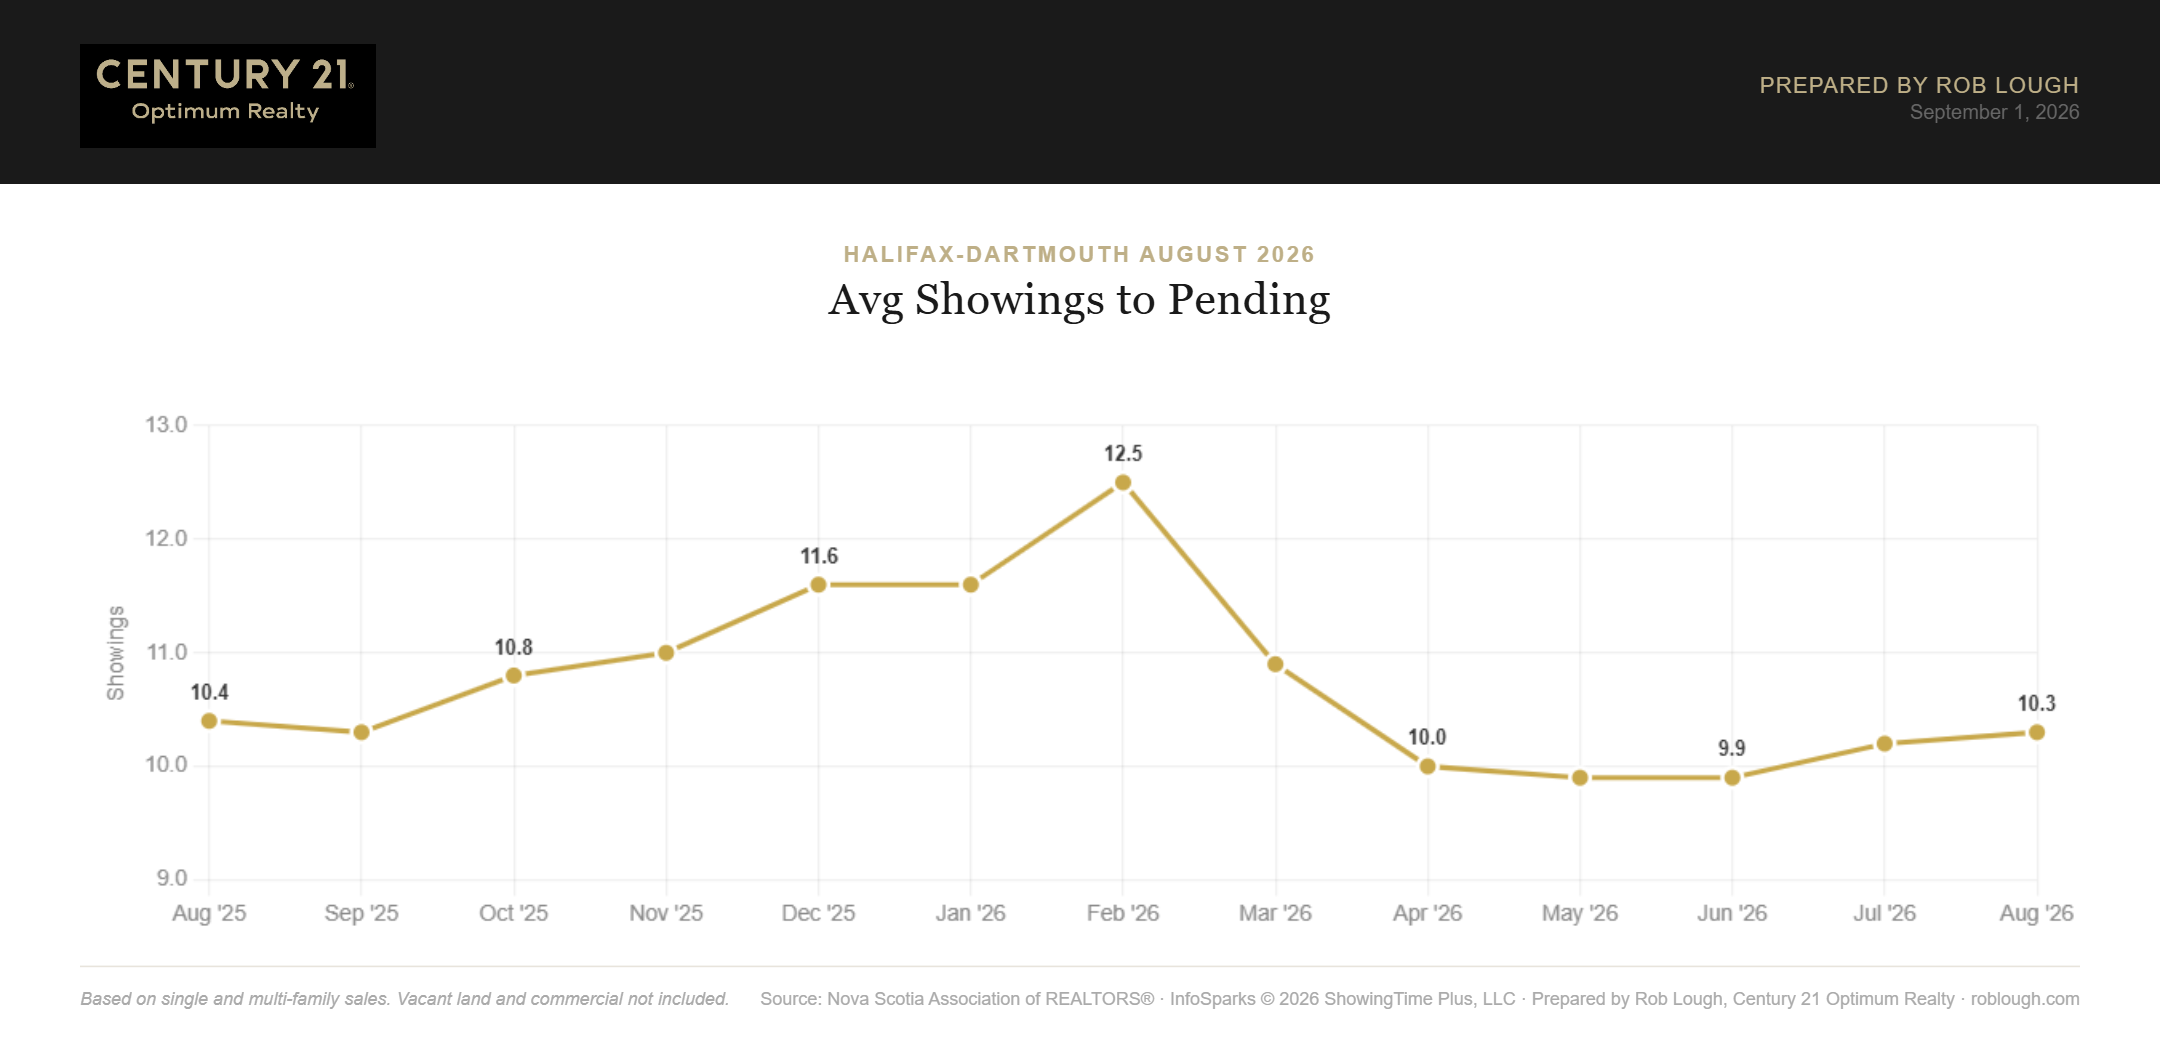
Halifax-Dartmouth Real Estate Market Stats August 2026 number of showings to pending
Average showings to pending was 10.3, essentially unchanged from 10.2 in July and 10.4 last August. Buyers here still need about ten viewings before committing, a figure that has been stable for over a year.
The read: fewer buyers are circulating, but the ones who are behave exactly as they always have.
What This Means for Buyers and Sellers
For buyers: You have roughly 21% more inventory to choose from than a year ago and a full extra week to make decisions. That is real, and it is the best position buyers have been in since 2021. But do not confuse Halifax-Dartmouth with the provincial picture. At 3.9 months supply and 98.3% of last list price, well-priced homes in good locations still move quickly and still attract competition. Be ready to act when the right one appears. Get your financing sorted first with our mortgage calculator and get pre-approved before you start touring. Our Buy a Home in Halifax NS guide walks through the rest.
For sellers: The window is narrower than it was in May but it has not closed. Homes are still selling at 98.3% of last list, which almost no other market in the province can say. The risk is entirely in the launch price. Your original-list ratio slipped to 96.5% this month, and every point of that decline came from listings that started too high and had to correct. Fewer showings per listing means fewer chances to make the right impression. Price it properly, present it well, and plan for about six weeks. Start with a free home valuation and run your bottom line through the Sellers Net Proceeds Calculator. More detail in Sell Your Home in Halifax NS.
The Bigger Picture
August 2026 marks the point where Halifax-Dartmouth and the rest of Nova Scotia visibly parted ways. The province pushed to 5.6 months of supply with inventory still climbing. Halifax-Dartmouth held at 3.9 with inventory flat and new listings matching last year exactly.
That divergence reflects the fundamentals that have driven this market for a decade: population growth concentrated in the urban core, constrained land supply within the regional centre, and a rental market tight enough to keep pushing people toward ownership. Those pressures have not changed. What has changed is that buyers now get to think before they act.
For a sense of how the two markets compare month to month, see the Nova Scotia market stats for August 2026 and the Halifax-Dartmouth Real Estate Dashboard.
Frequently Asked Questions
Is Halifax-Dartmouth a buyer’s or seller’s market in August 2026? Still a seller’s market. Months supply held at 3.9, well below the six-month balanced-market threshold, and homes are selling at 98.3% of their last list price. Conditions have eased considerably from a year ago, but the balance of leverage has not flipped.
Are Halifax home prices going down? Mixed. The median is down 2.7% year over year at $550,000 and the average is down 1.7% at $610,082, but price per square foot is up 1.3%. The declines reflect a shift in what is selling rather than a broad drop in what homes are worth.
How long does it take to sell a home in Halifax-Dartmouth? Average days on market was 40 in August 2026, up from 38 a year earlier. Well-priced homes in strong neighbourhoods still sell considerably faster. Six weeks is a sensible planning horizon.
How much below asking are Halifax homes selling for? The average sale closed at 98.3% of the last list price and 96.5% of the original list price. On a $600,000 home, that spread works out to about $11,000 lost to price reductions before the sale.
Why is Halifax tighter than the rest of Nova Scotia? Halifax-Dartmouth sits at 3.9 months of supply against 5.6 province-wide. Population growth is concentrated in the urban core, developable land inside the regional centre is limited, and the rental market remains tight. New listings in August matched last August almost exactly, so supply is not building here the way it is elsewhere.
Should I wait to buy? Nothing in this data points to a coming price drop in Halifax-Dartmouth. Inventory stopped rising this month and per-square-foot values are still up year over year. Buyers have gained real negotiating room already, which is the advantage worth using. Reach out directly to talk through a specific property or neighbourhood.
About This Report
Data is sourced from the Nova Scotia Association of REALTORS® and covers Halifax-Dartmouth area residential sales for August 2026. Area-wide figures may not reflect conditions in a specific neighbourhood, price band, or property type.
Related Resources
- Halifax-Dartmouth Real Estate Market Stats: July 2026
- Halifax-Dartmouth Real Estate Market Stats: June 2026
- Halifax-Dartmouth Condo Market Report: July 2026
- Halifax/Dartmouth Real Estate Market Stats hub
- Halifax-Dartmouth Real Estate Dashboard
- How to Price Your Home to Sell in Halifax
- Why Getting Pre-Approved Is the Smartest First Step
- Closing Costs When Buying in Nova Scotia
- What a Home Inspector Looks for in Halifax Houses
- Free Home Valuation
- Sellers Net Proceeds Calculator
- Mortgage Calculator
- Contact Rob Lough

