
 Facebook
 X
X
 Pinterest
 Copy Link
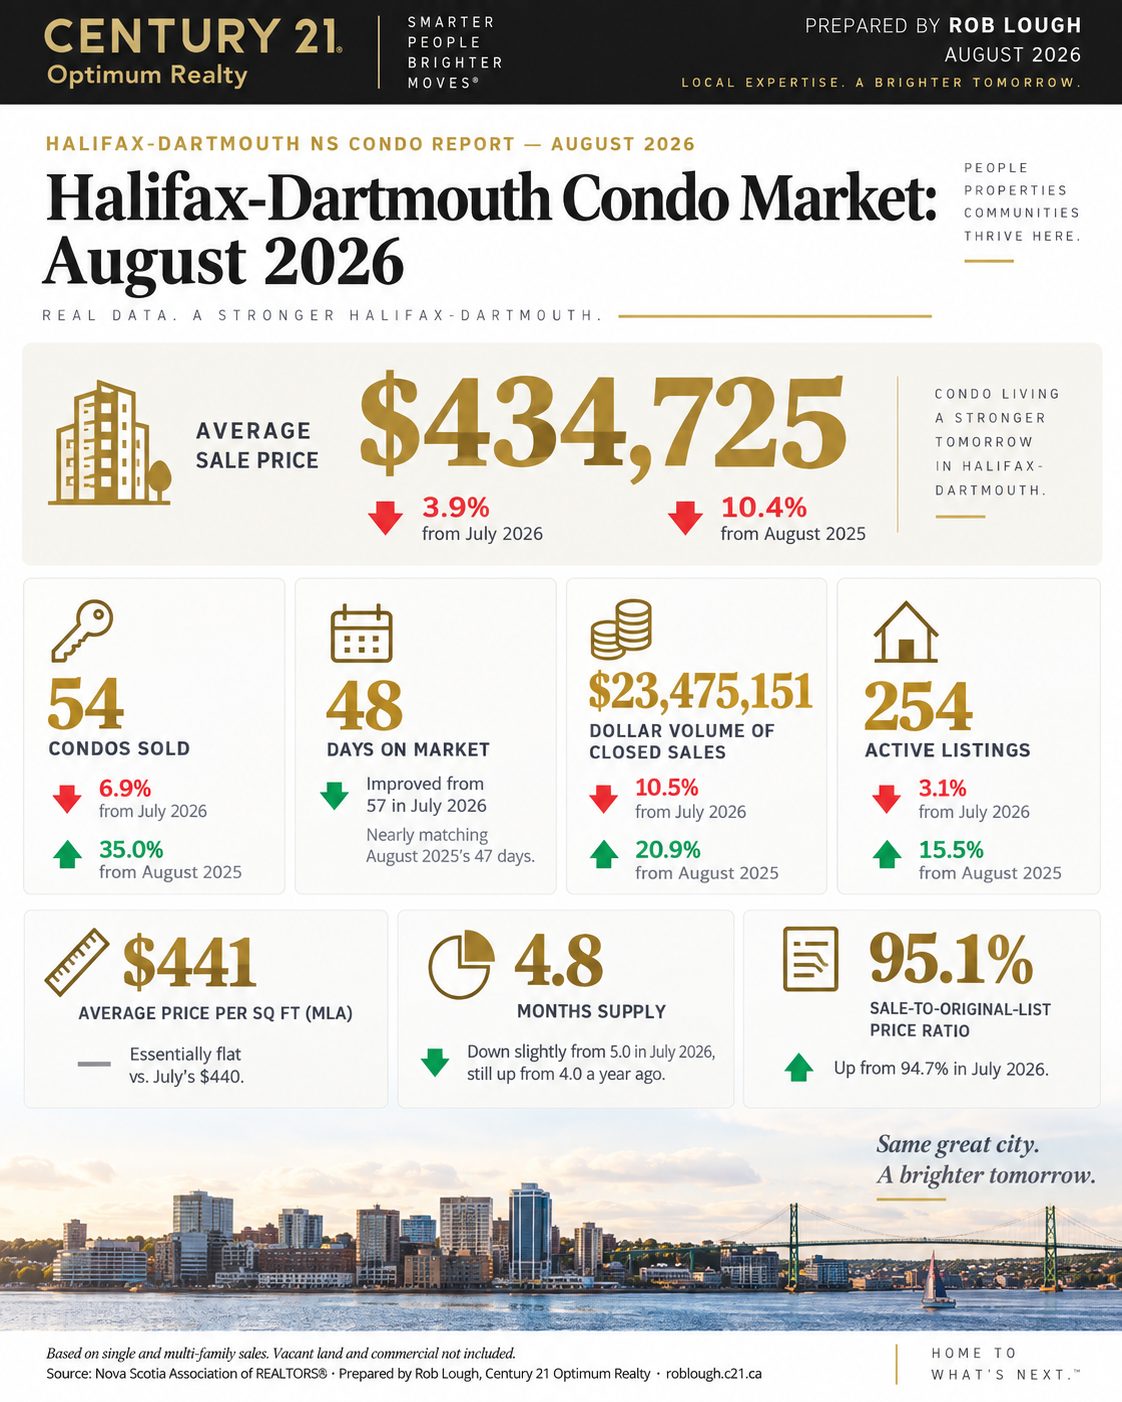
Halifax-Dartmouth Condo Market Report: August 2026
By Rob Lough, Broker/Owner | Century 21 Optimum Realty
After July’s sharp pullback, the Halifax-Dartmouth condo market found some footing in August 2026. Sales activity eased further and prices stayed soft, but days on market and list-price discipline both improved from July — a sign the market may be stabilizing at a lower level rather than continuing to slide. Here’s what the numbers show.
Key Takeaways: Halifax-Dartmouth Condos, August 2026
- 54 condos sold in Halifax-Dartmouth in August 2026, down 6.9% from July but up 35.0% from August 2025.
- Average sale price: $434,725, down 3.9% from July and down 10.4% year-over-year.
- Median sale price: $407,500, up 1.3% from July’s $402,450 but down 8.9% from a year ago.
- Average days on market: 48 days, an improvement from 57 in July, and just 1 day longer than August 2025.
- Dollar volume of closed sales: $23,475,151, down 10.5% from July and up 20.9% year-over-year.
- 254 active condo listings, with months supply easing slightly to 4.8 from July’s 5.0 — still well above the 4.0 months seen a year ago.
Sales Activity
Condo sales slowed again in August, with 54 units sold versus 58 in July — a 6.9% dip. But the year-over-year comparison tells a very different story: August 2026’s sales were up a striking 35.0% over the 40 condos sold in August 2025, a reminder of just how quiet last August was by comparison.
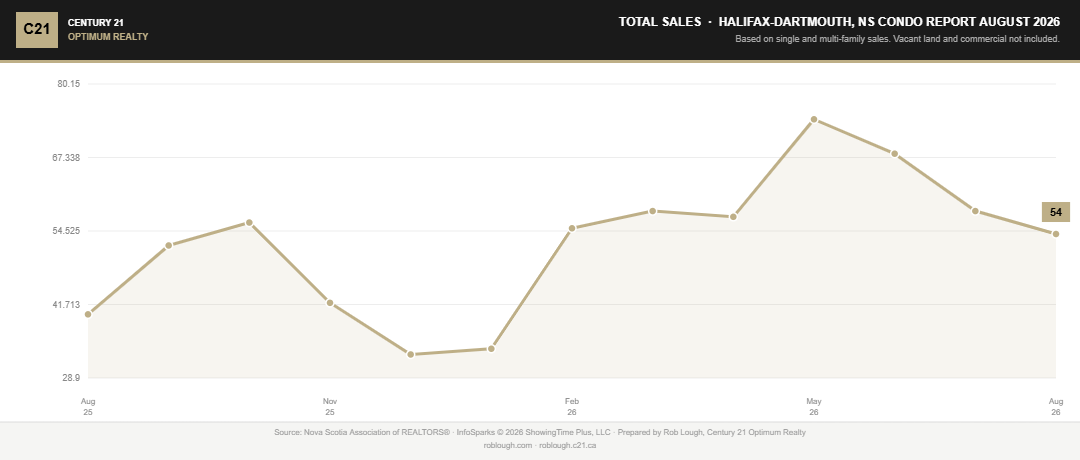
Halifax-Dartmouth Condo Market Report August 2026 number of sales
Dollar volume came in at $23,475,151, down 10.5% from July’s $26.2M and up 20.9% from August 2025’s $19.4M — sales at a lower average price, but still well ahead of last year’s pace.
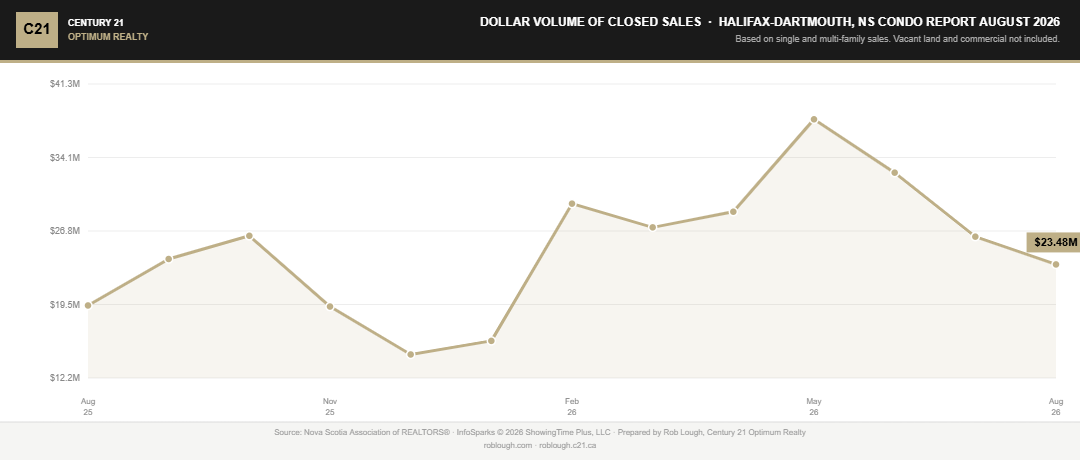
Halifax-Dartmouth Condo Market Report August 2026 dollar volume of closed sales
Pending sales fell to 52, down 14.8% from July’s 61, and continuing the summer’s cooling trend heading into fall closings.
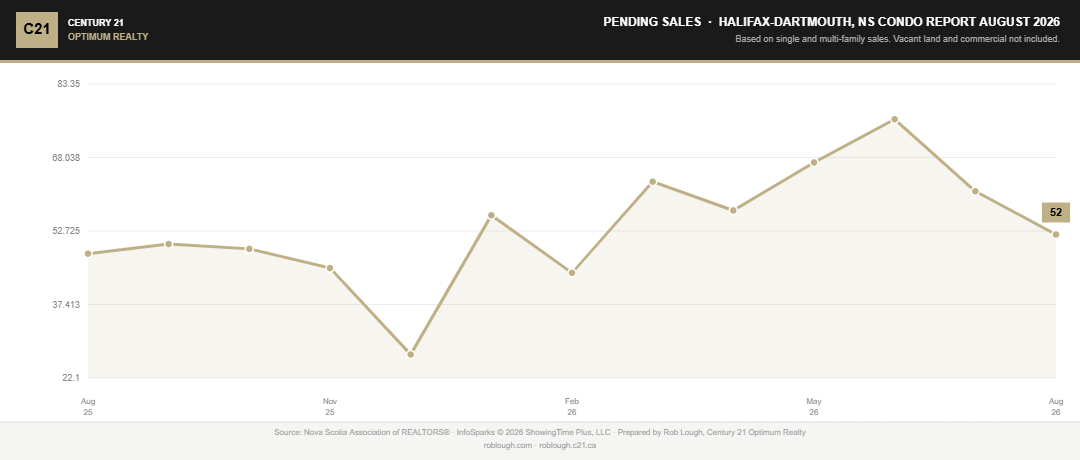
Halifax-Dartmouth Condo Market Report August 2026 number of pending sales
Prices: Median Ticks Up, Average Keeps Sliding
The two price measures diverged again in August. Average sale price fell to $434,725, down 3.9% from July and now 10.4% below August 2025 — the softest average price reading in the 13-month dataset.
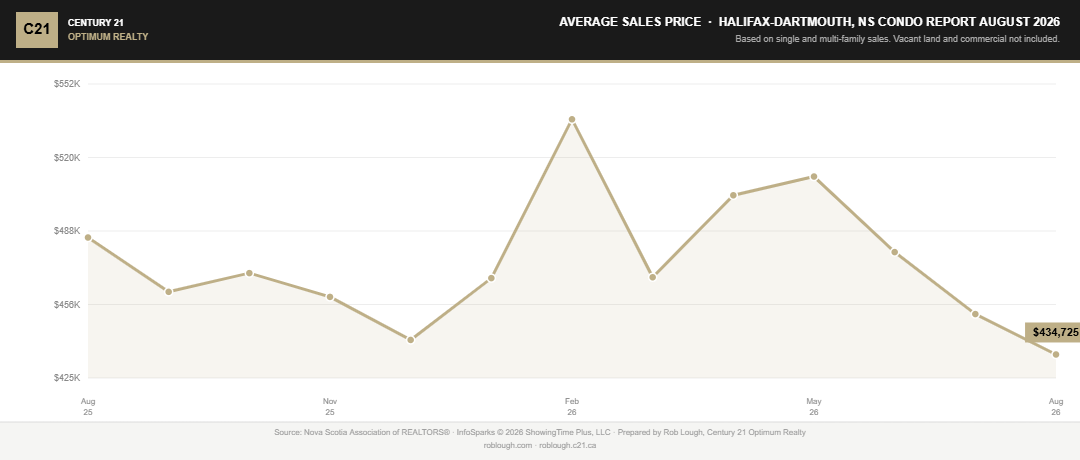
Halifax-Dartmouth Condo Market Report August 2026 average sales price
Median sale price, however, edged up 1.3% to $407,500 from July’s $402,450, even though it remains 8.9% below a year ago.
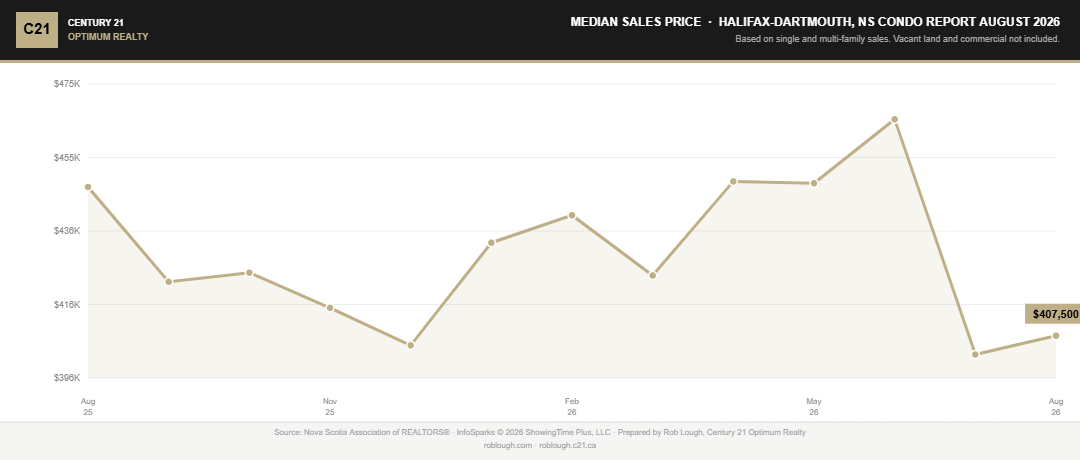
Halifax-Dartmouth Condo Market Report August 2026 median sales price
Price per square foot also pulled back on both measures: average price per square foot (TLA) dropped to $422 from $428 in July, and price per square foot (MLA) slipped to $441 from $440 — essentially flat. Taken together, the price picture in August looks less dramatic than July’s plunge, more like a market settling into a lower range.
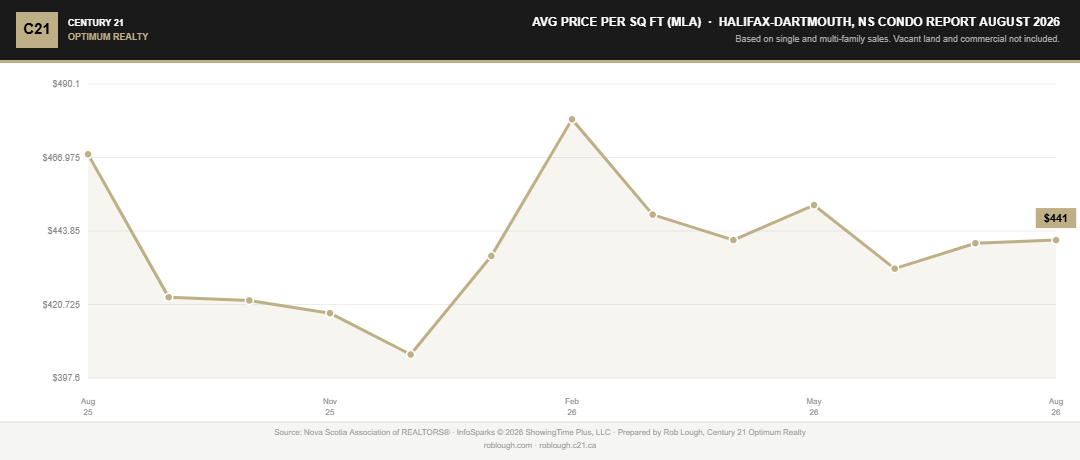
Halifax-Dartmouth Condo Market Report August 2026 average price per square foot
Inventory & Months Supply
Active condo inventory eased to 254 listings in August from 262 in July (down 3.1%), but remains 15.5% above the 220 listings on the market in August 2025.
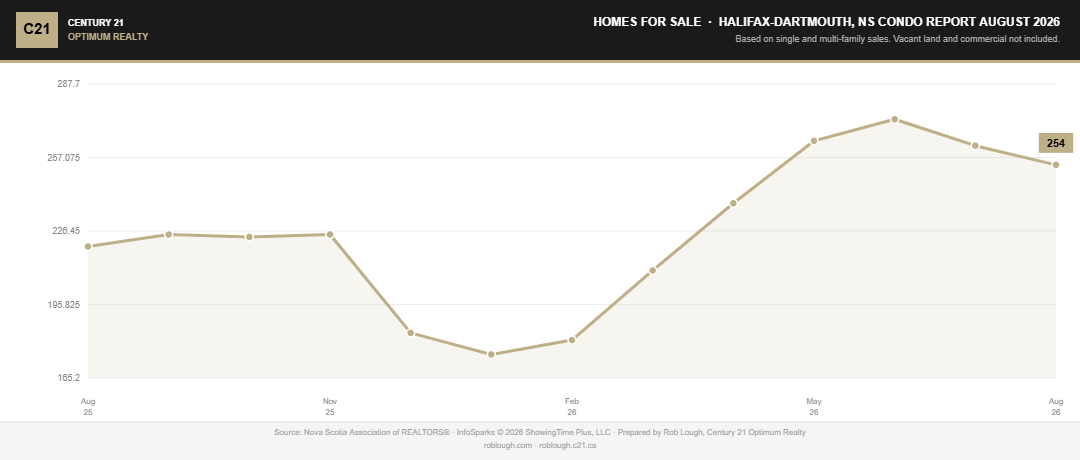
Halifax-Dartmouth Condo Market Report August 2026 number of condos for sale
New listings rose to 94 in August, up 5.6% from July’s 89 — modestly restocking inventory even as demand cooled.
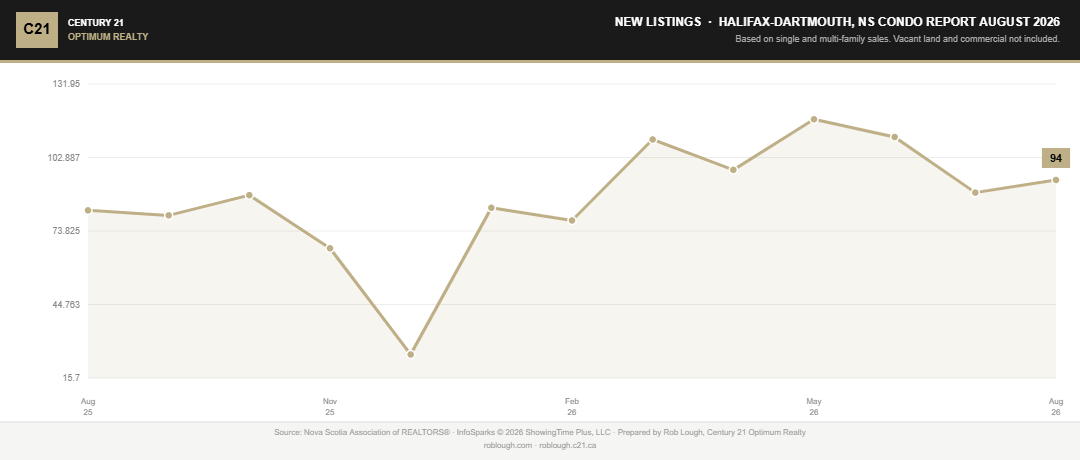
Halifax-Dartmouth Condo Market Report August 2026 number of new condo listings for sale
Months supply came down to 4.8 from July’s 5.0, though it’s still well above the 4.0-month reading from a year ago — inventory has built up meaningfully over the past 12 months even as August’s numbers show a slight easing.
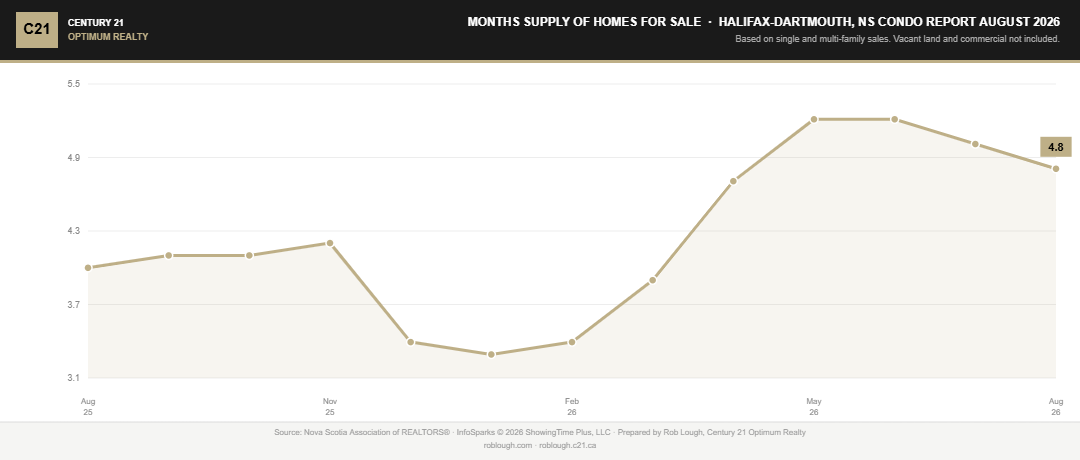
Halifax-Dartmouth Condo Market Report August 2026 number of months supply of condo inventory
Days on Market & Pricing Discipline Improve
The clearest sign of stabilization: average days on market fell to 48 in August from 57 in July, a nine-day improvement, and nearly matched August 2025’s 47 days.
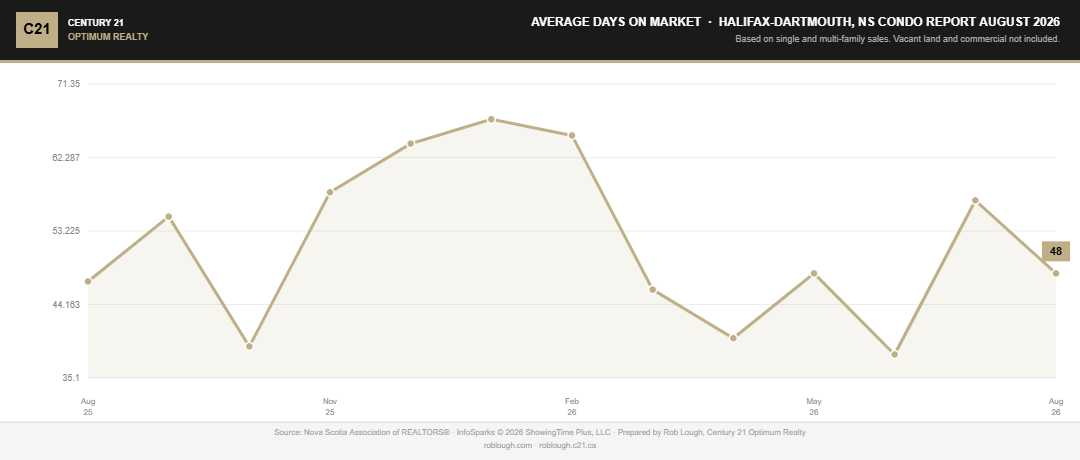
Halifax-Dartmouth Condo Market Report August 2026 average days on market
Sellers also regained a bit of ground on pricing — the average percent of last list price held essentially flat at 97.2% (versus 97.3% in July).
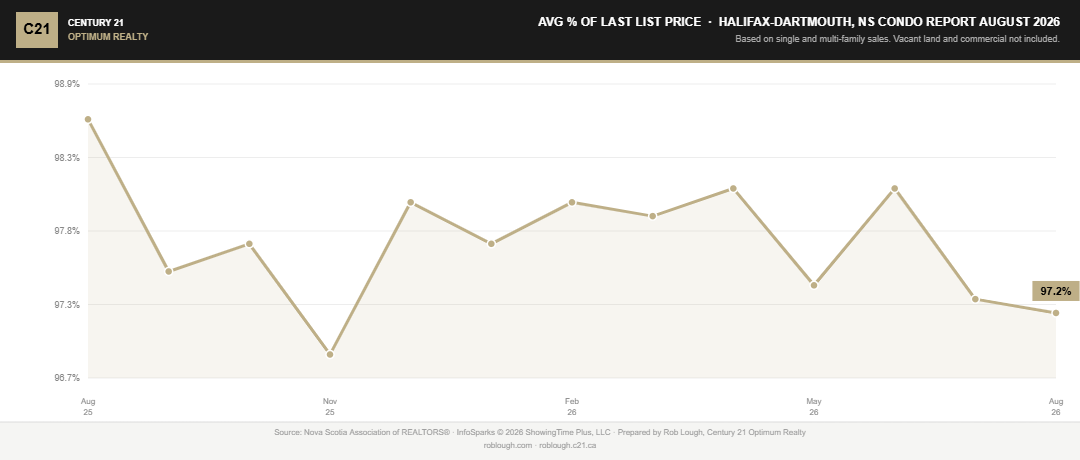
Halifax-Dartmouth Condo Market Report August 2026 average % of last list price
The sale-to-original-list-price ratio rose to 95.1% from 94.7% in July, a modest improvement in seller leverage.
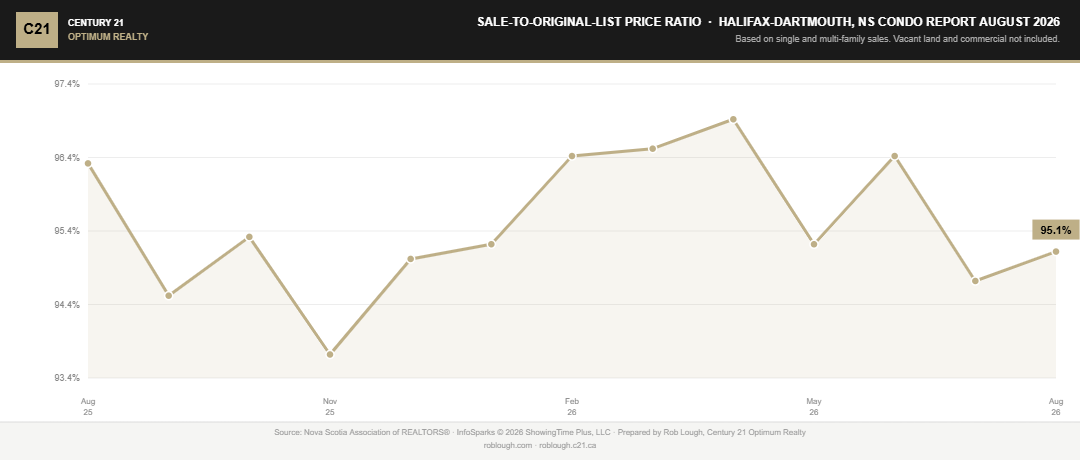
Halifax-Dartmouth Condo Market Report August 2026 average % of original list price
Showings Activity
Showings per listing held nearly steady at 3.2, up slightly from July’s 3.1.
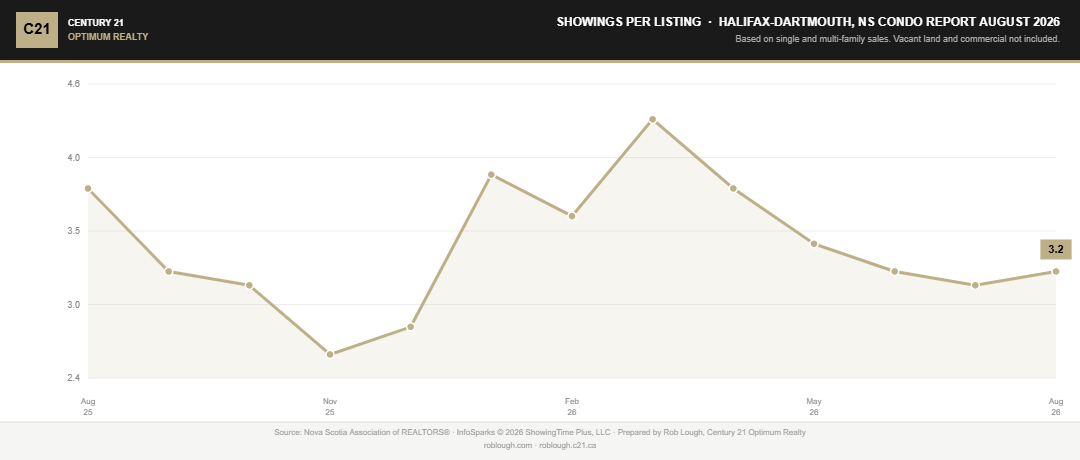
Halifax-Dartmouth Condo Market Report August 2026 average number of showings per listing
The average showings-to-pending ratio dropped to 7.8 from 8.6 in July — the lowest reading in the dataset — suggesting that when buyers did show up, they converted to offers more efficiently than earlier in the summer.
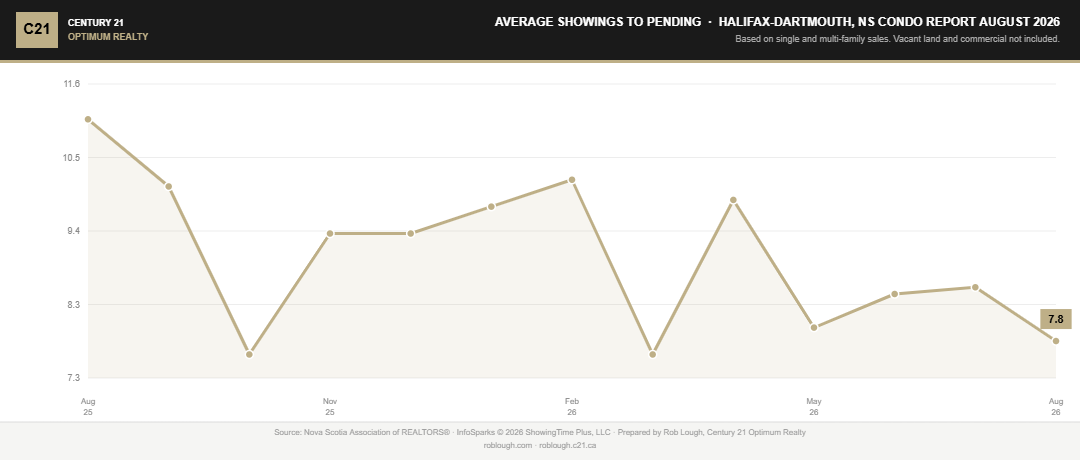
Halifax-Dartmouth Condo Market Report August 2026 average number of showings to pending
What This Means for Buyers and Sellers
August’s data suggests the condo market’s July slowdown didn’t continue to accelerate — days on market improved, showings converted better, and sale-to-list ratios ticked up. That said, average price is still trending lower and inventory remains well above year-ago levels, so buyers continue to have more choice and more negotiating room than they did a year ago. Sellers who price in line with where the market has settled, rather than where it was in the spring, are seeing the fastest results.
If you’re weighing a move in the Halifax-Dartmouth condo market, I’d be glad to walk through what these numbers mean for your specific building, unit type, or price point. You can also check current listings and trends any time on the Halifax-Dartmouth Real Estate Dashboard, or get a free, no-obligation estimate of your home’s value with our Free Home Valuation tool.
For last month’s numbers, see the Halifax-Dartmouth Condo Market Report: July 2026. You can find all of our monthly updates in the Market Stats section of the blog.
Source: Nova Scotia Association of REALTORS® (InfoSparks © 2026 ShowingTime Plus, LLC). Halifax-Dartmouth Area, Condo segment. Prepared by Rob Lough, Broker/Owner, Century 21 Optimum Realty.
Chart export checklist (drop C21_Market_Data_with_Condo.xlsx → Halifax-Dartmouth Condo tab into your chart generator, export these 13 in your usual “Professional Report” style, then swap each placeholder above):
- Total Units Sold
- Dollar Volume of Closed Sales
- Pending Sales
- Average Sales Price
- Median Sales Price
- Average Price Per Square Foot (MLA)
- Homes for Sale (Inventory)
- New Listings
- Months Supply of Homes for Sale
- Average Days on Market
- Average % of Last List Price
- Sale-to-Original-List Price Ratio
- Showings Per Listing
- Average Showings to Pending

