
 Facebook
 X
X
 Pinterest
 Copy Link
Halifax-Dartmouth Real Estate Market Stats: September 2026
By Rob Lough, Broker/Owner | Century 21 Optimum Realty | October 1, 2026
Halifax-Dartmouth’s brief plateau didn’t hold. After inventory ticked down in August for the first time since January, it climbed again in September, new listings jumped double digits month-over-month, and both sales and prices eased. The area is still meaningfully tighter than the province as a whole, but September’s numbers look more like a return to the gradual-loosening trend than a genuine stabilization.
Here is the full September 2026 picture.
Key Takeaways: Halifax-Dartmouth, September 2026
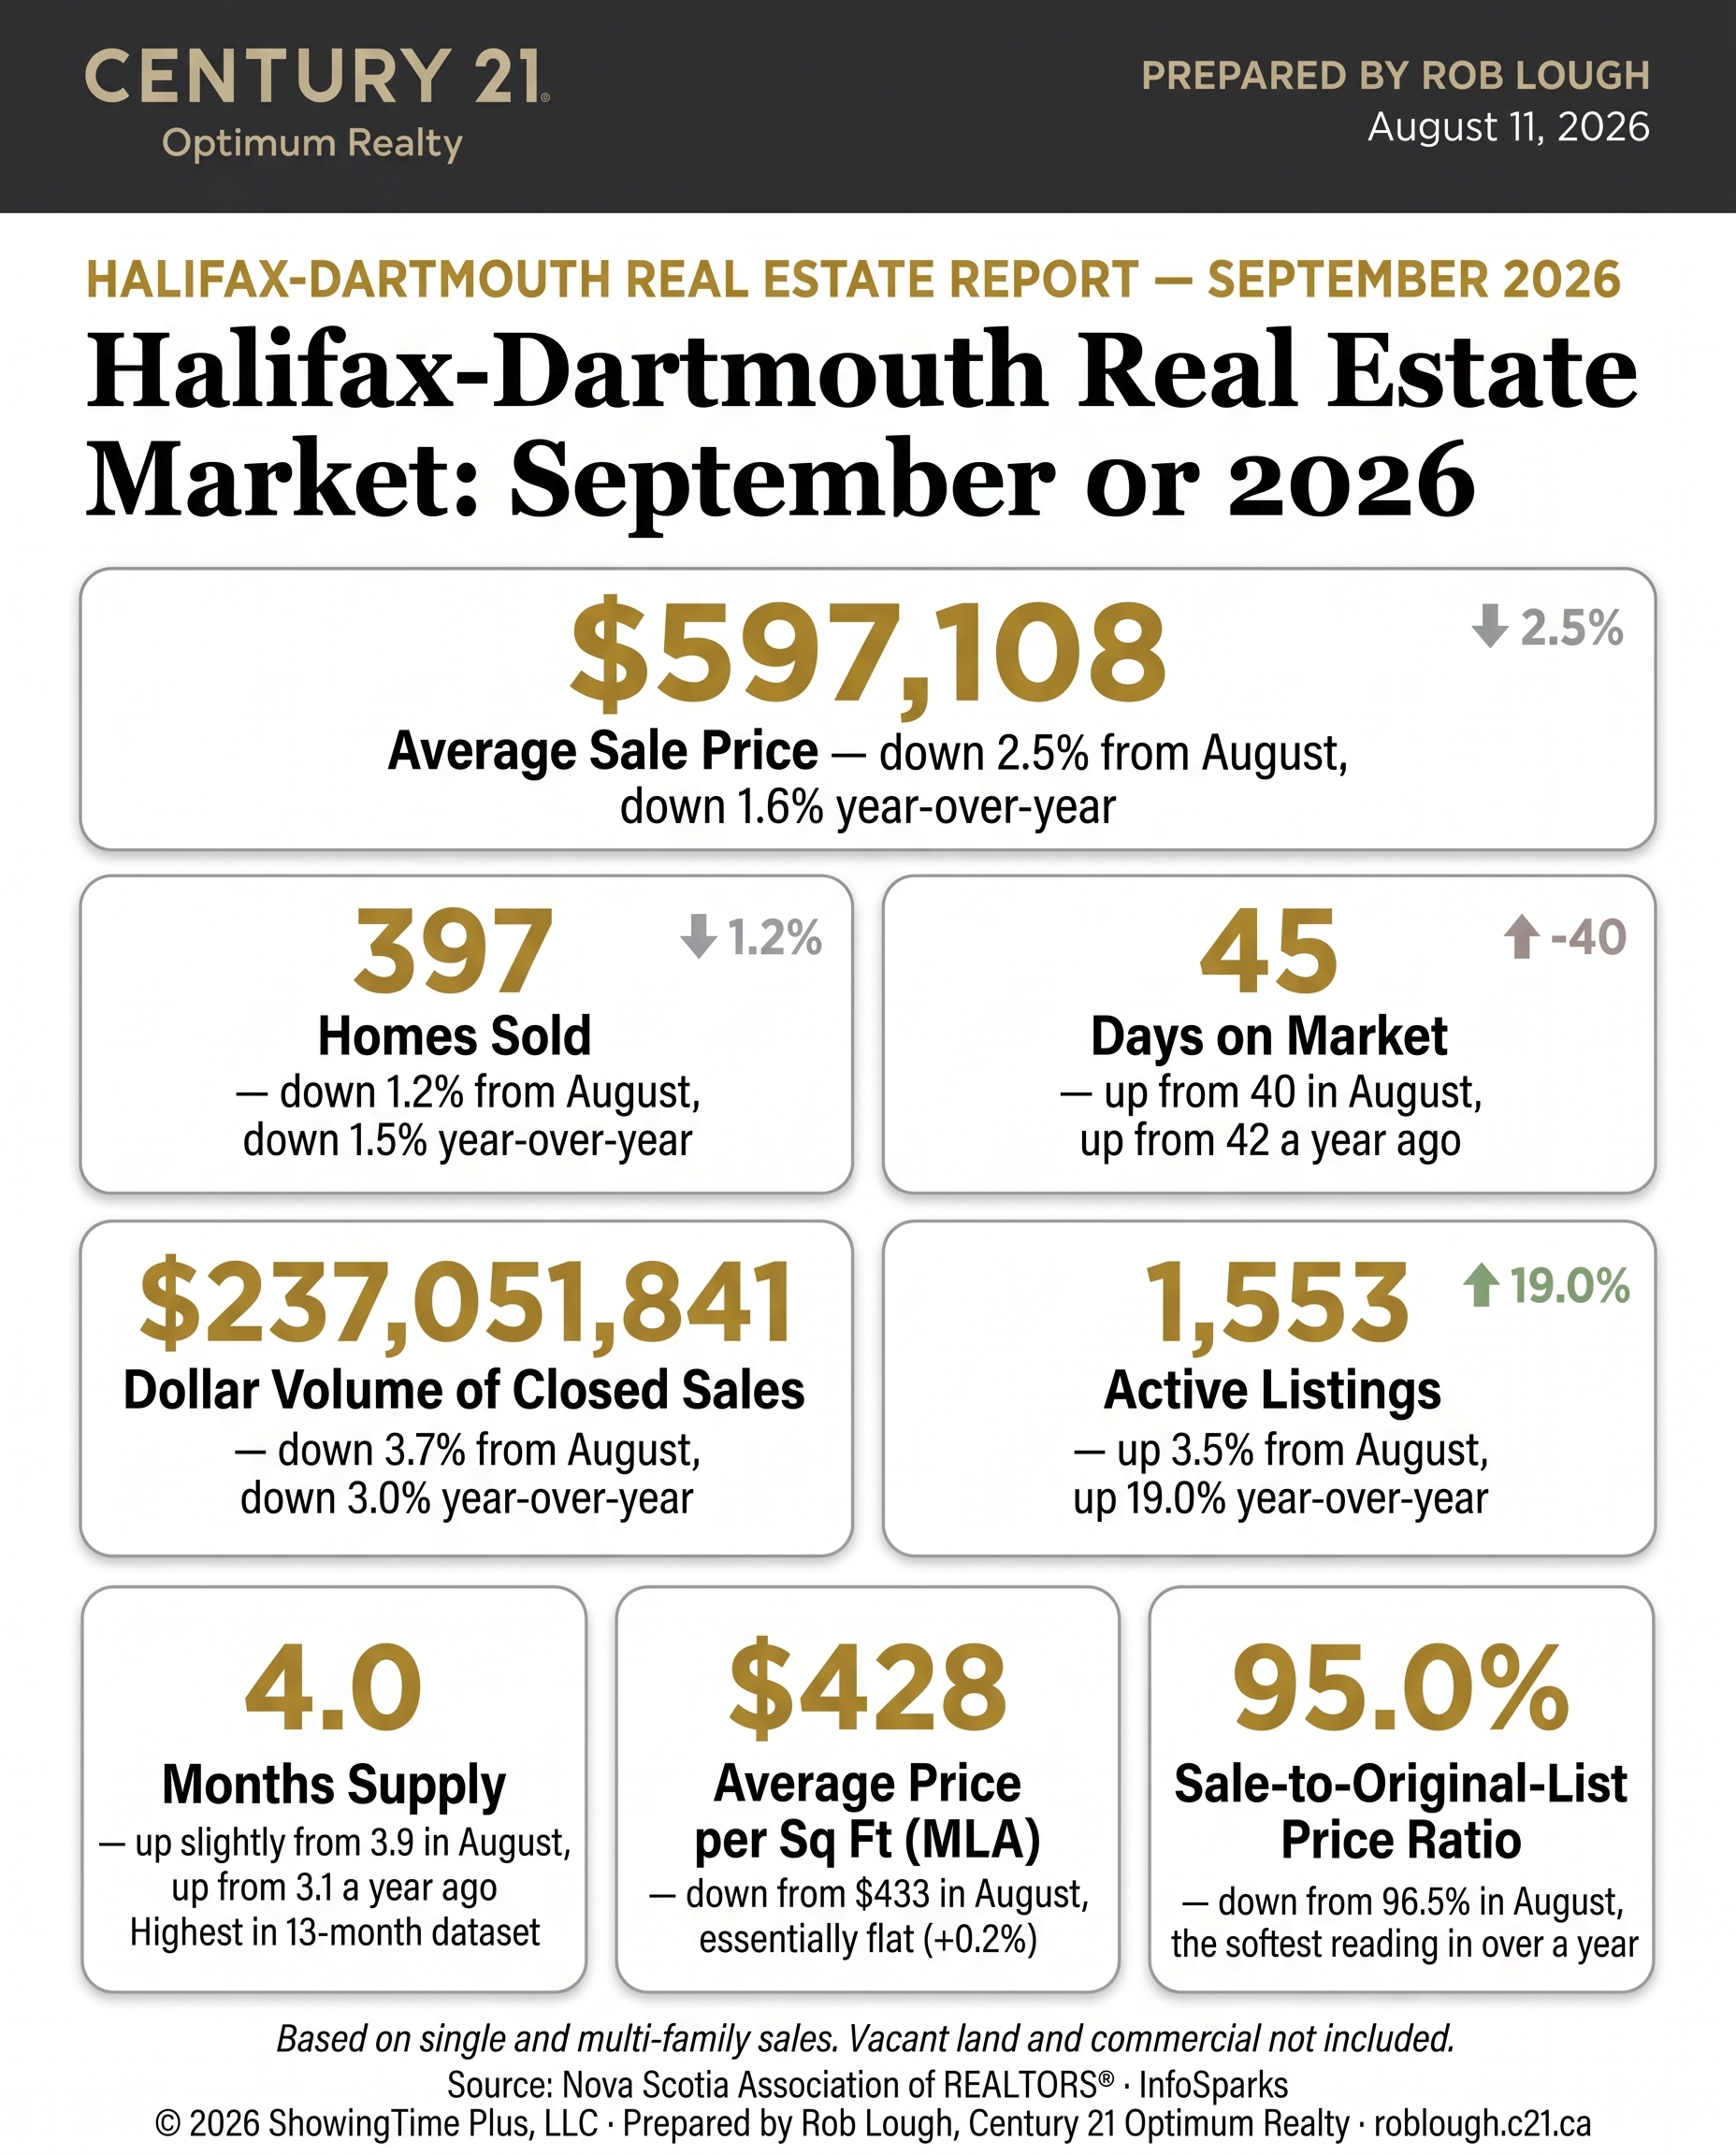
- 397 homes sold, down 1.2% from August and down 1.5% from September 2025
- Average sales price eased to $597,108, down 2.5% from August and down 1.6% year-over-year
- Median price slipped to $548,000, down 1.3% from August and down 1.7% year-over-year
- Active inventory climbed back to 1,553 homes, up 3.5% from August and up 19.0% year-over-year
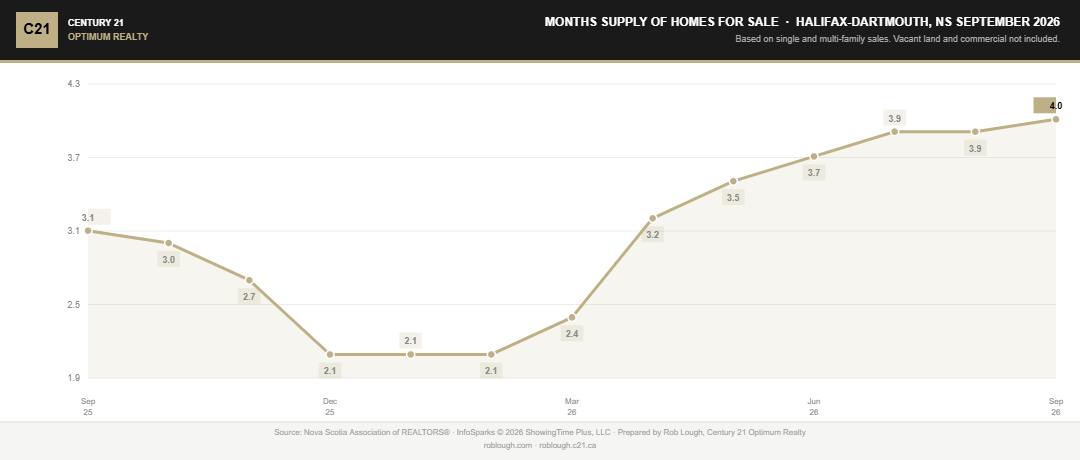
- Months supply edged up to 4.0, still well inside seller’s-market territory but the highest reading in the 13-month dataset
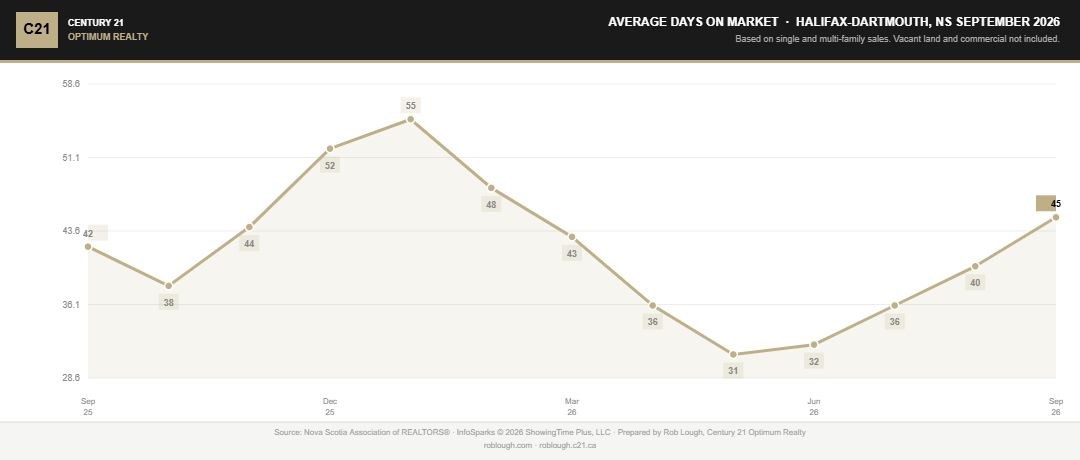
- Days on market lengthened to 45, up from 40 in August
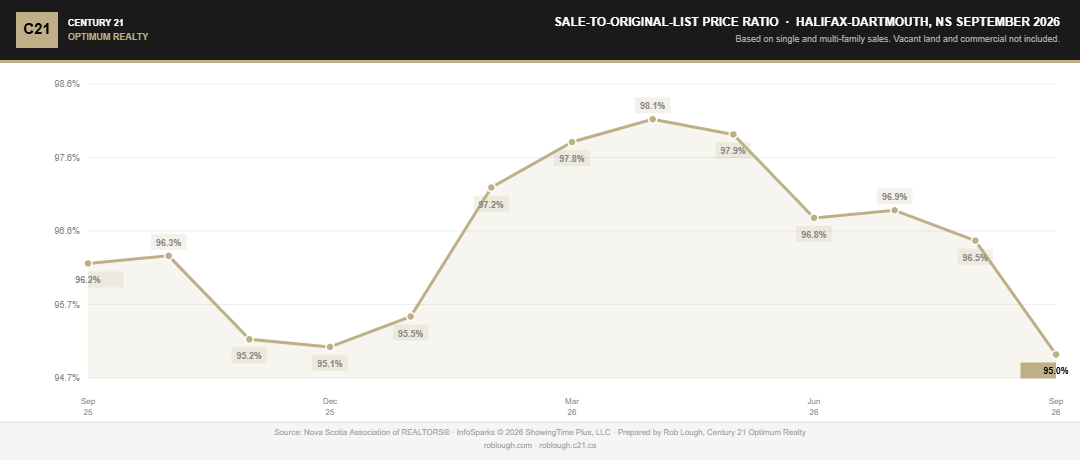
- Sellers received 95.0% of original list price, the softest reading in over a year
Total Units Sold
Halifax-Dartmouth Real Estate Market Stats September 2026 Total number of units sold
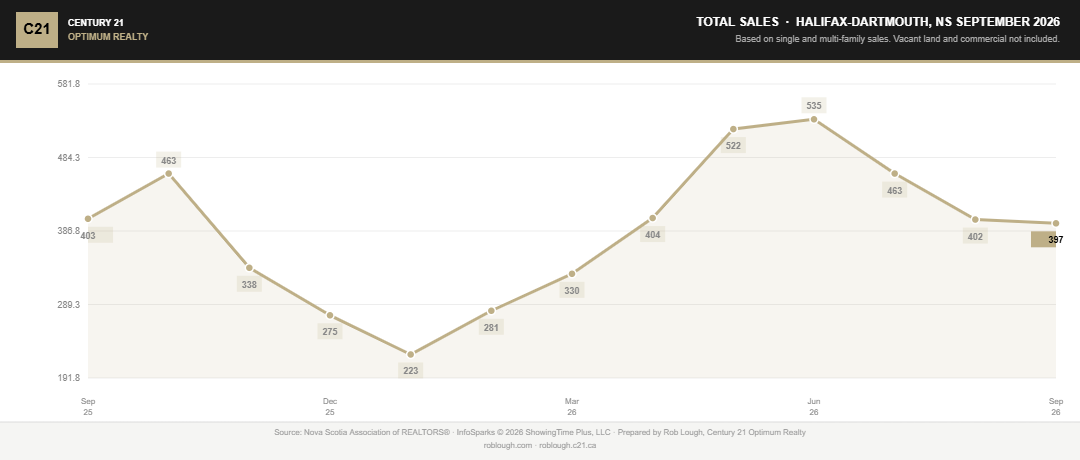
Sales totalled 397 in September, down from 402 in August (-1.2%) and down 1.5% from 403 a year ago. That’s a second straight month of sales in the high-390s to low-400s, well off the 535-sale June peak but essentially flat compared to last September.
Pending sales rose to 409, up 7.3% from August’s 381, which points to a steadier October than the headline sales figure alone would suggest.
Dollar Volume of Closed Sales
Halifax-Dartmouth Real Estate Market Stats September 2026 dollar volume of closed sales
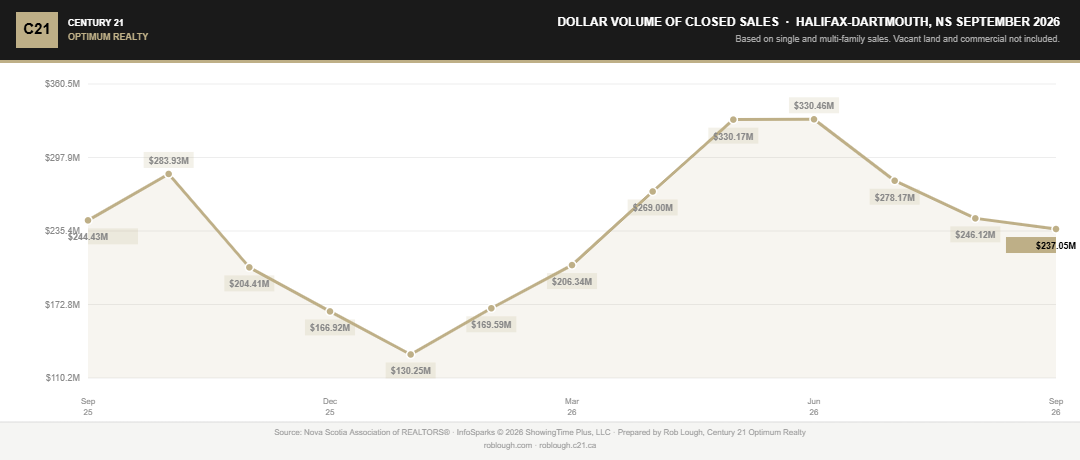
Dollar volume came in at $237.1 million in September, down from $246.1 million in August (-3.7%) and down 3.0% from $244.4 million a year ago.
Volume eased faster than unit count, pointing again to a mix effect, a slightly smaller average transaction, not fewer buyers in the market.
Average Sales Price
Halifax-Dartmouth Real Estate Market Stats September 2026 average sales price
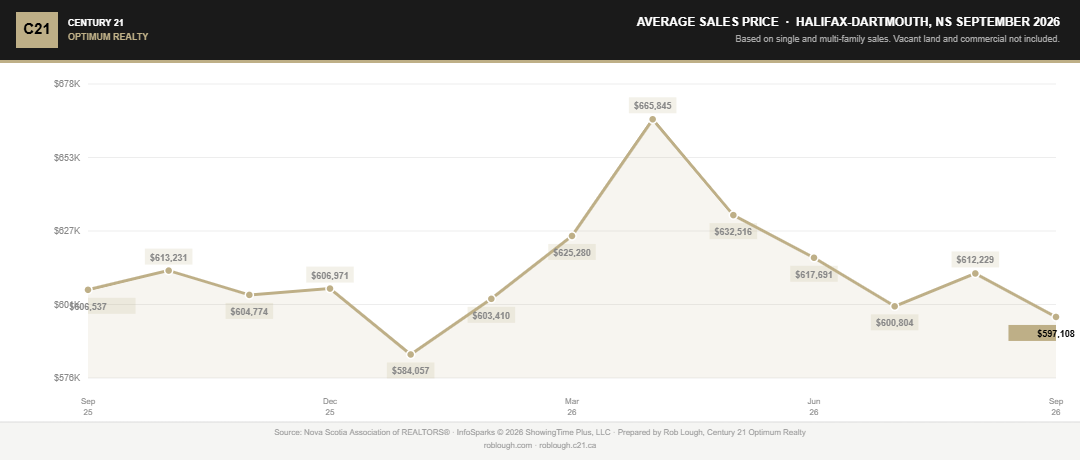
The average sales price eased to $597,108 in September, down 2.5% from August’s $612,229 and down 1.6% from $606,537 in September 2025.
Halifax-Dartmouth still commands roughly $116,000 more than the provincial average of $480,903, a premium that has held consistently throughout the year even as both markets have softened.
Median Sales Price
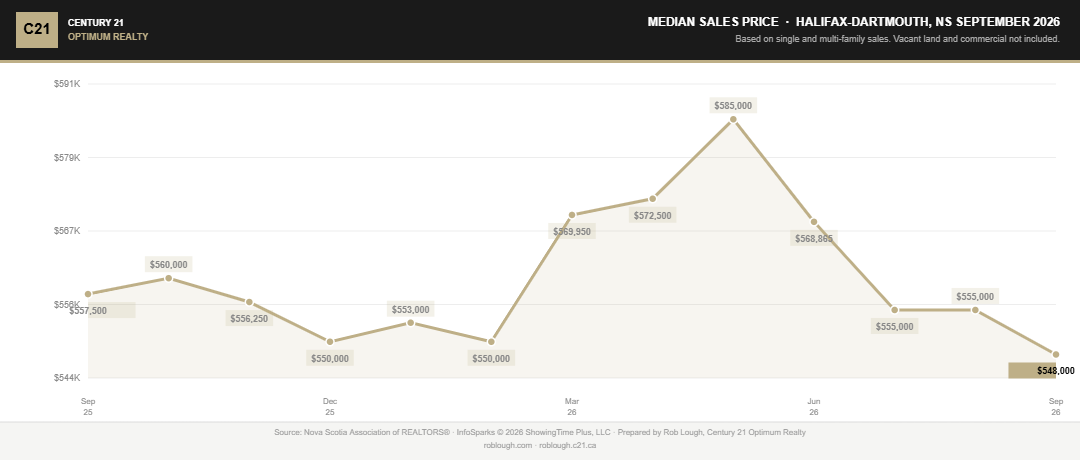
Halifax-Dartmouth Real Estate Market Stats September 2026 median sales price
The median sales price was $548,000 in September, down 1.3% from August’s $555,000 and down 1.7% from $557,500 a year earlier. This is the lowest median reading in the trailing 13 months.
With both average and median easing together this month, the softness looks broader-based than August’s upper-end-driven pattern, more properties across the price spectrum selling for somewhat less, rather than just a mix shift.
Average Price Per Square Foot
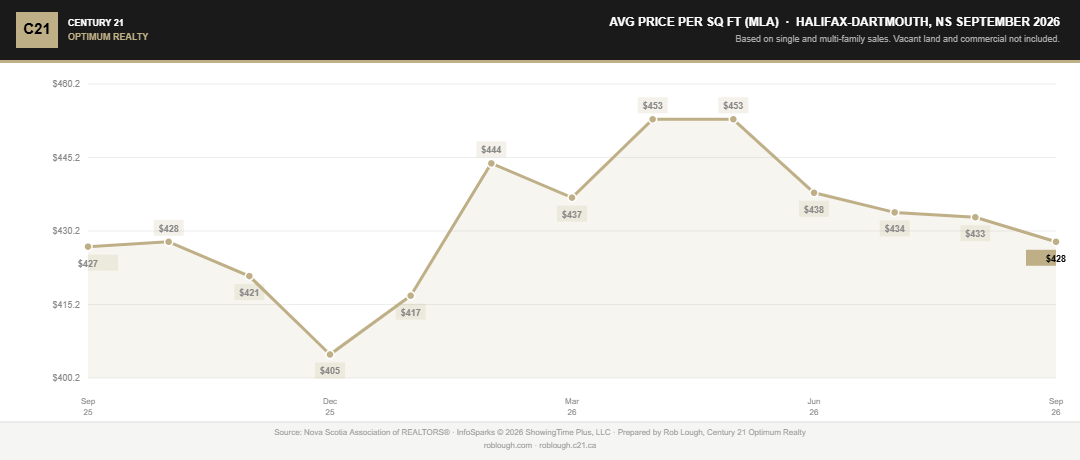
Halifax-Dartmouth Real Estate Market Stats September 2026 average price per sq foot MLA
Price per square foot on total living area was $321 in September, up slightly from $320 in August and unchanged from $321 last September. On main living area, the figure was $428, down from $433 in August but up 0.2% from $427 a year ago.
Per-square-foot values are essentially holding flat year-over-year even as headline average and median prices have softened — a sign the underlying value of Halifax-Dartmouth real estate hasn’t moved much, even if the dollar figures bounce around month to month.
New Listings
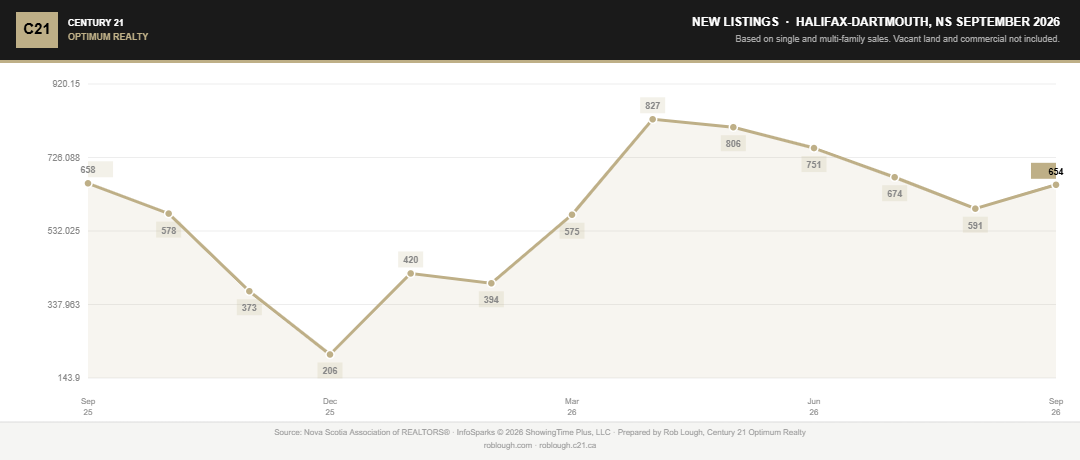
Halifax-Dartmouth Real Estate Market Stats September 2026 number of new listings
New listings jumped to 654 in September, up 10.7% from August’s 591, though still down 0.6% from 658 a year ago. After August’s pause, sellers came back to the market at close to last September’s pace, this is the detail that explains why inventory resumed climbing.
Homes for Sale (Active Inventory)
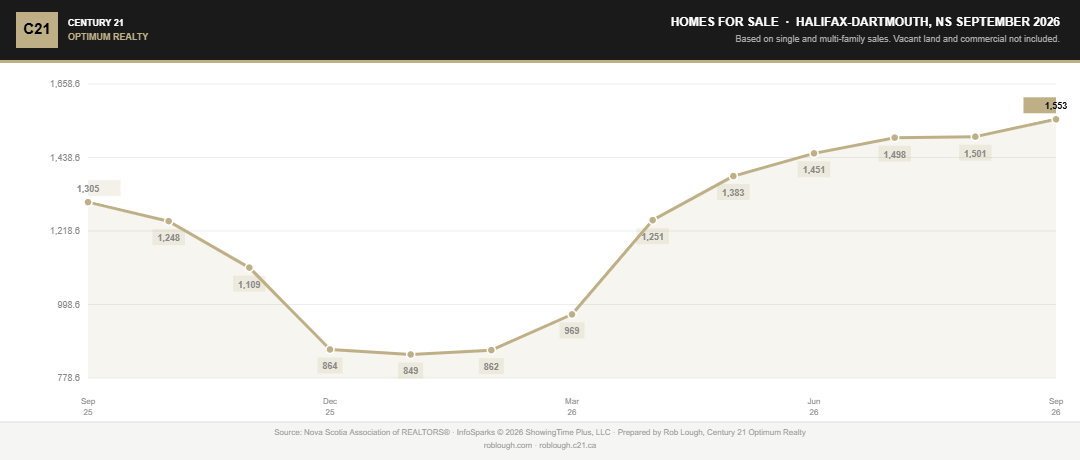
Halifax-Dartmouth Real Estate Market Stats September 2026 number of homes for sale
Active inventory climbed to 1,553 homes in September, up 3.5% from August’s 1,501 and up 19.0% from 1,305 a year ago.
August’s small dip turned out to be a pause rather than a plateau. Inventory has now built in eight of the past nine months.
Months Supply of Homes for Sale
Halifax-Dartmouth Real Estate Market Stats September 2026 number of homes for sale months supply of inventory
Months supply ticked up to 4.0 in September, from 3.9 in August and up from 3.1 a year ago, the highest reading in this 13-month dataset.
Four months is still comfortably within seller’s-market territory, and still far tighter than the province’s 5.7 months. But the gap has been narrowing steadily since spring, and this month’s new-listings jump suggests it will keep narrowing into fall.
Average Days on Market
Halifax-Dartmouth Real Estate Market Stats September 2026 average days on market
Homes took an average of 45 days to sell in September, up from 40 in August and up from 42 a year ago. The market has now slowed for four straight months from the May low of 31 days.
Forty-five days is still well ahead of the provincial average of 53. But the gap is closing, and sellers should plan on roughly six to seven weeks rather than the month they might have budgeted in the spring.
Sale-to-Last-List Price Ratio
Halifax-Dartmouth Real Estate Market Stats September 2026 average % of last list price
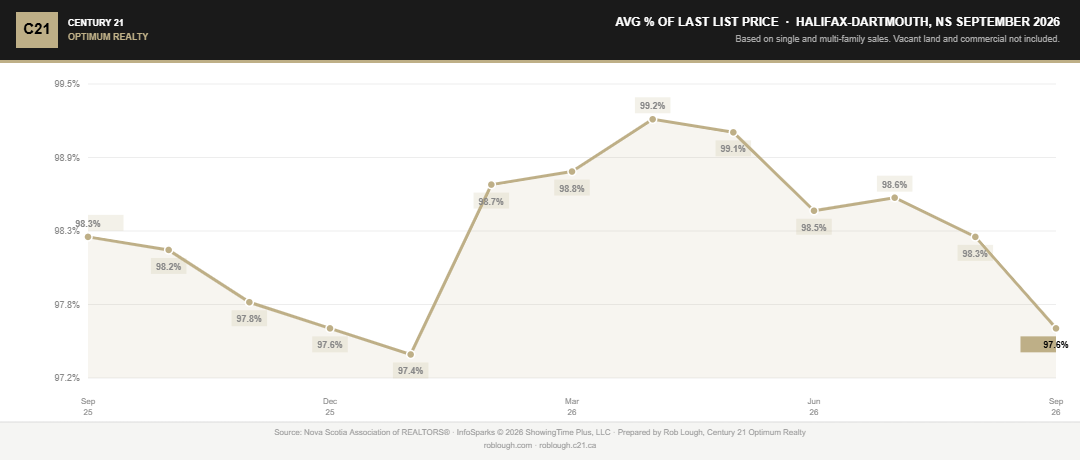
Sellers received 97.6% of their last list price in September, down from 98.3% in August and 98.3% a year ago.
Still a strong result by any standard, but it’s the softest last-list reading in the trailing 13 months.
Sale-to-Original-List Price Ratio
Halifax-Dartmouth Real Estate Market Stats September 2026 average % of original list price
Against the original list price, the ratio was 95.0%, down from 96.5% in August and 96.2% a year ago, the lowest reading in this dataset.
The 2.6-point spread between the two ratios is the clearest cost-of-mispricing signal yet in Halifax-Dartmouth. On a $600,000 home, that works out to roughly $15,600 lost to starting too high, noticeably wider than August’s $11,000 estimate, and now closer to the provincial spread of 3.1 points than it’s been all year.
Showings Per Listing
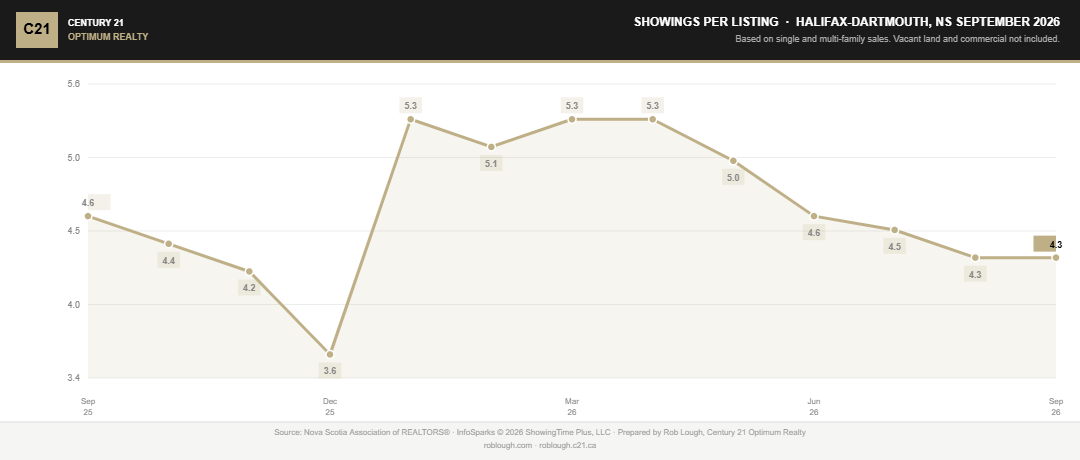
Halifax-Dartmouth Real Estate Market Stats September 2026 number of showings per listing
Showings per listing held at 4.3 in September, unchanged from August and down from 4.6 a year ago.
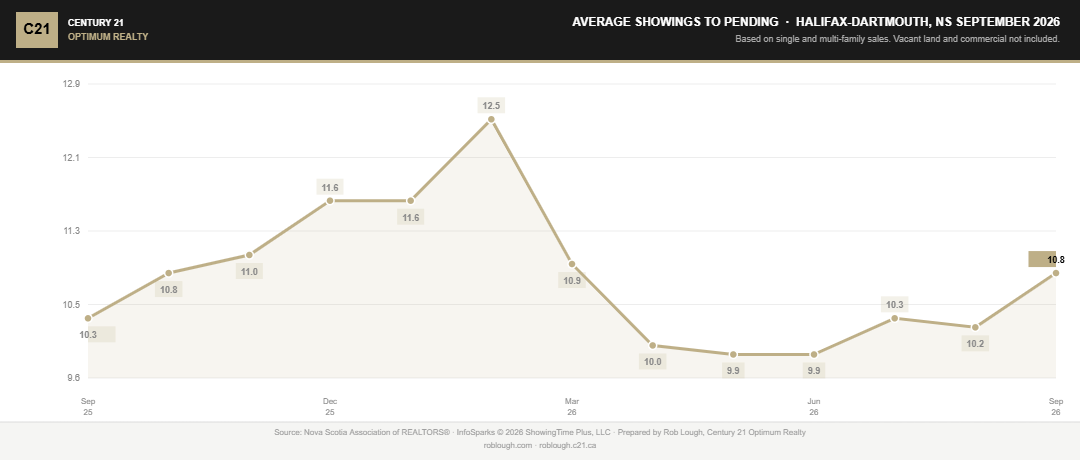
Halifax-Dartmouth Real Estate Market Stats September 2026 number of showings to pending
Average showings to pending rose to 10.8, up from 10.2 in August and above 10.3 last September. Buyers are taking slightly more viewings to reach a decision than they were a month ago, consistent with a market where choice continues to build.
What This Means for Buyers and Sellers
For buyers: You now have 19% more inventory than a year ago, and the gap keeps widening. Days on market has stretched to 45, and the original-list ratio of 95.0% means the average seller is giving up real ground. This is the most buyer-friendly September in this dataset. That said, Halifax-Dartmouth is still tighter than the province and well-priced homes in strong locations continue to move faster than the headline numbers suggest, so don’t assume every property is negotiable. Get your financing sorted first with our mortgage calculator and get pre-approved before you start touring. Our Buy a Home in Halifax NS guide walks through the rest.
For sellers: September is the clearest warning sign yet in this dataset. The sale-to-original-list ratio fell to its lowest point in over a year, and new listings jumped 10.7% month-over-month, meaning more competition is arriving just as buyers are taking longer to decide. Pricing correctly from day one matters more now than it has all year. Start with a free home valuation and run your numbers through the Sellers Net Proceeds Calculator. More detail in Sell Your Home in Halifax NS.
The Bigger Picture
August’s pause looked like it might be the start of a genuine plateau for Halifax-Dartmouth. September’s numbers say otherwise: new listings rebounded sharply, inventory resumed its climb, and the sale-to-original-list ratio posted its weakest reading of the year. The gap between Halifax-Dartmouth (4.0 months supply) and the province (5.7 months) remains real, but it has narrowed every month since spring.
The underlying fundamentals, population growth concentrated in the urban core, constrained land supply, and a tight rental market, haven’t changed. What’s changed is that the pace of the market’s cooling, which looked like it might be leveling off, has picked back up.
For a sense of how the two markets compare month to month, see the Nova Scotia market stats for September 2026 and the Halifax-Dartmouth Real Estate Dashboard.
Frequently Asked Questions
Is Halifax-Dartmouth a buyer’s or seller’s market in September 2026? Still technically a seller’s market, with months supply at 4.0 — well below the six-month balanced-market threshold. But the margin is the thinnest it’s been in this dataset, and the trend is moving toward balance.
Are Halifax home prices going down? Both median ($548,000, -1.7% year-over-year) and average ($597,108, -1.6%) eased, and price per square foot is roughly flat. The declines look more broad-based this month than in August, though still modest in scale.
How long does it take to sell a home in Halifax-Dartmouth? Average days on market was 45 in September 2026, up from 42 a year earlier and the longest reading in the trailing 13 months.
How much below asking are Halifax homes selling for? The average sale closed at 97.6% of the last list price and 95.0% of the original list price — on a $600,000 home, that’s roughly $15,600 lost to price reductions before the sale, the widest gap in this dataset.
Why did inventory start climbing again after August’s dip? New listings jumped 10.7% from August to September, nearly matching last September’s pace after a quiet summer. With sales holding flat, that fresh supply flowed straight into active inventory.
Should I wait to buy? Price per square foot is essentially flat year-over-year, so there’s no clear signal of an imminent drop. But buyers have gained real, growing negotiating room, the original-list ratio keeps softening each month. Reach out directly to talk through a specific property or neighbourhood.
About This Report
Data is sourced from the Nova Scotia Association of REALTORS® and covers Halifax-Dartmouth area residential sales for September 2026. Area-wide figures may not reflect conditions in a specific neighbourhood, price band, or property type.
Related Resources
- Halifax-Dartmouth Real Estate Market Stats: August 2026
- Halifax-Dartmouth Real Estate Market Stats: July 2026
- Halifax-Dartmouth Condo Market Report: August 2026
- Halifax/Dartmouth Real Estate Market Stats hub
- Halifax-Dartmouth Real Estate Dashboard
- How to Price Your Home to Sell in Halifax
- Why Getting Pre-Approved Is the Smartest First Step
- Closing Costs When Buying in Nova Scotia
- What a Home Inspector Looks for in Halifax Houses
- Free Home Valuation
- Sellers Net Proceeds Calculator
- Mortgage Calculator
- Contact Rob Lough
Data source: Nova Scotia Association of REALTORS® (2026 ShowingTime Plus, LLC). Prepared by Rob Lough, Broker/Owner, Century 21 Optimum Realty.

