
 Facebook
 X
X
 Pinterest
 Copy Link
Halifax-Dartmouth Real Estate Market Statistics 2025: Complete Year-End Analysis
Understanding the 2025 Halifax-Dartmouth Market
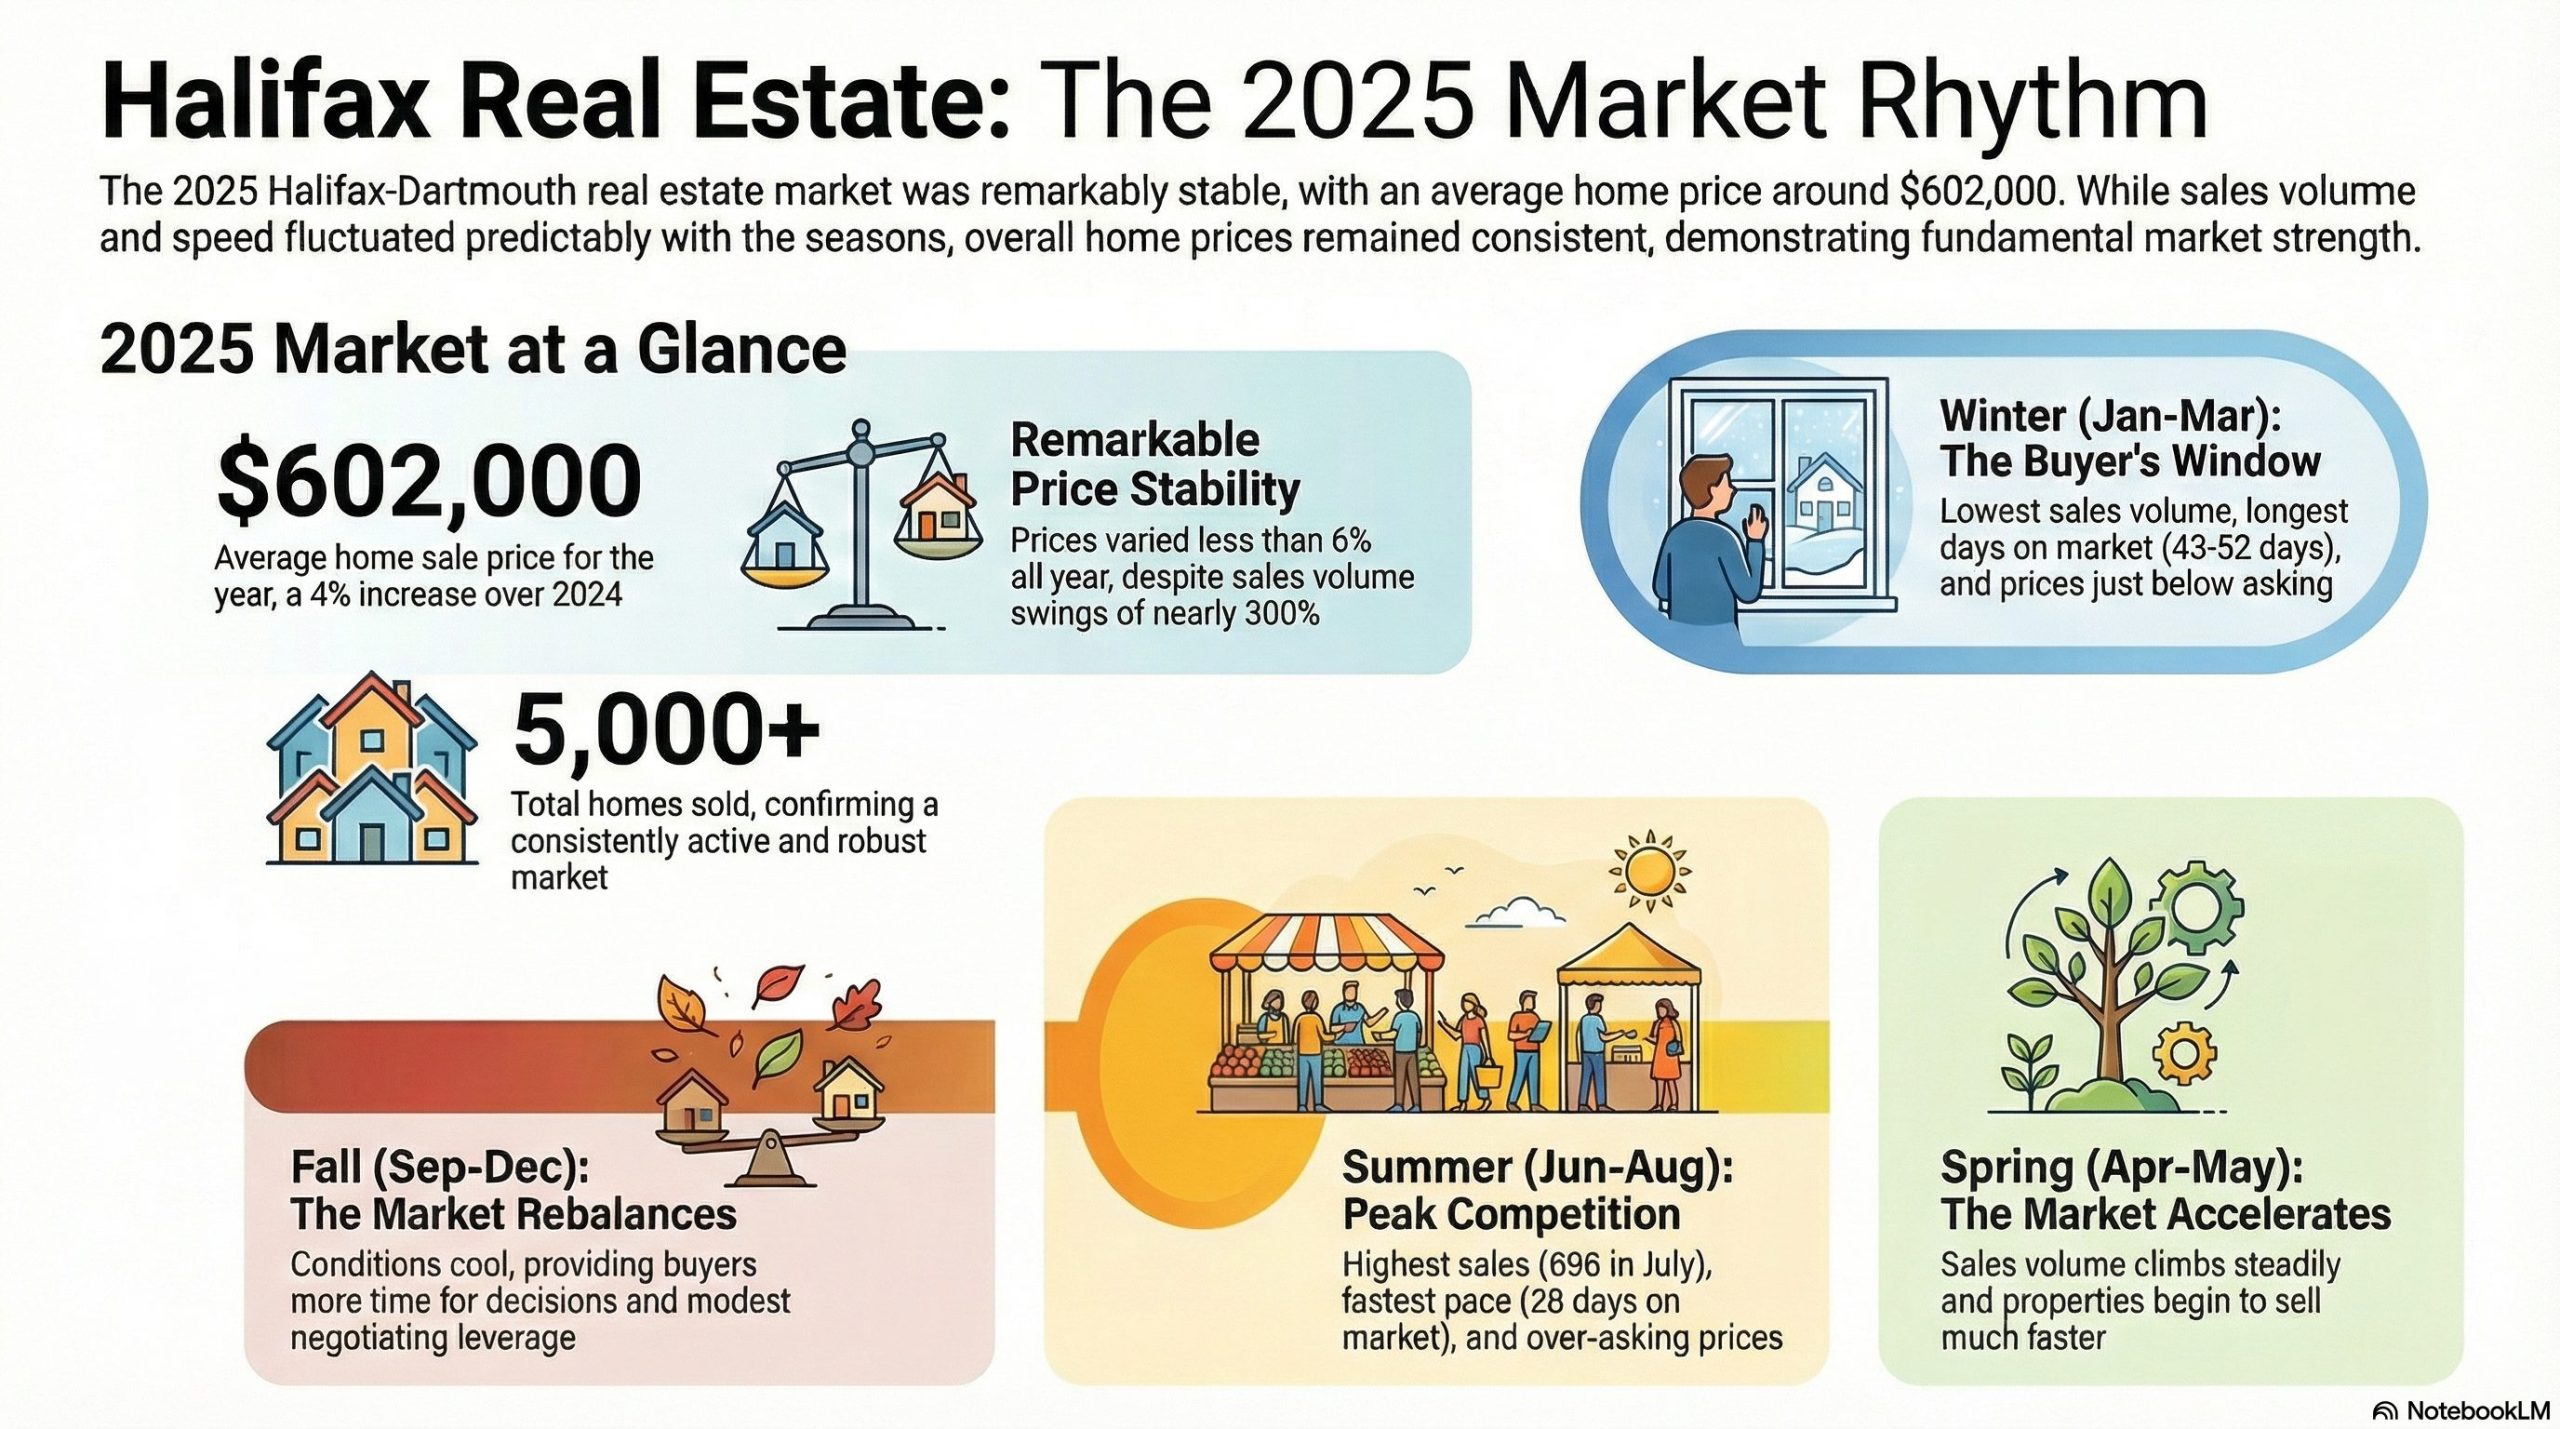
The Halifax-Dartmouth real estate market concluded 2025 with impressive stability and predictable seasonal patterns. Average home prices settled around $602,000, representing healthy 4% appreciation from 2024, while transaction volumes demonstrated the classic spring-summer surge that characterizes our regional market. This detailed analysis examines every key metric to help buyers, sellers, and investors understand what shaped the market throughout the year.
Home Price Performance Throughout 2025
Pricing stability emerged as 2025’s defining characteristic. The year opened with January average prices in the high-$580,000 range, climbed to a peak of $614,607 during the competitive summer months, and finished December at $601,068. This relatively narrow range—less than 6% variation across the entire year—signals a mature market that has moved beyond the volatility of pandemic-era boom cycles.
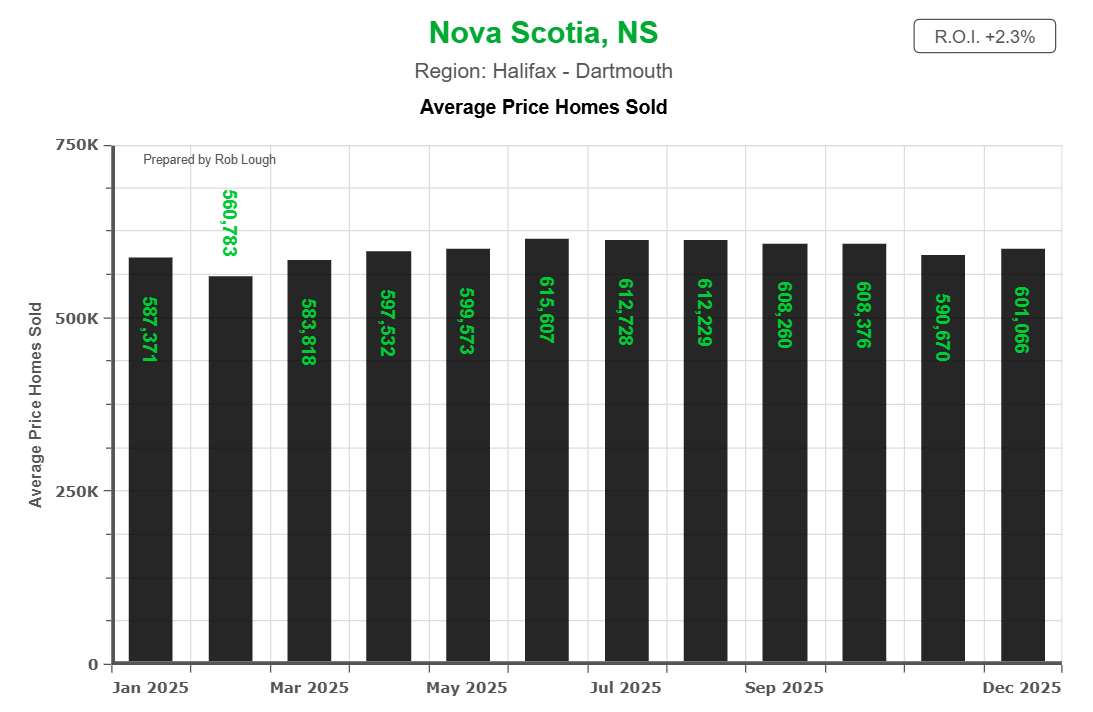
Halifax-Dartmouth 2025 average home sale prices by month with 2.3% ROI
The year-to-date average of approximately $602,000 represents measured, sustainable appreciation rather than speculative pricing. For prospective buyers exploring mortgage calculations and affordability, these price levels translate to monthly payments that remained remarkably consistent regardless of purchase timing throughout the year.
What makes this stability particularly noteworthy is that it persisted despite dramatic fluctuations in sales volume. While the number of monthly transactions swung by nearly 300%, average prices stayed within a tight band—evidence of fundamental market strength driven by sustained demand and limited housing inventory.
Transaction Volumes and Sales Activity
Monthly sales activity followed highly predictable seasonal patterns throughout 2025. The year began slowly, with January recording 304 units sold before February dropped to the year’s lowest point at just 239 transactions—typical for the depths of Maritime winter when both buyer activity and listing inventory reach annual lows.
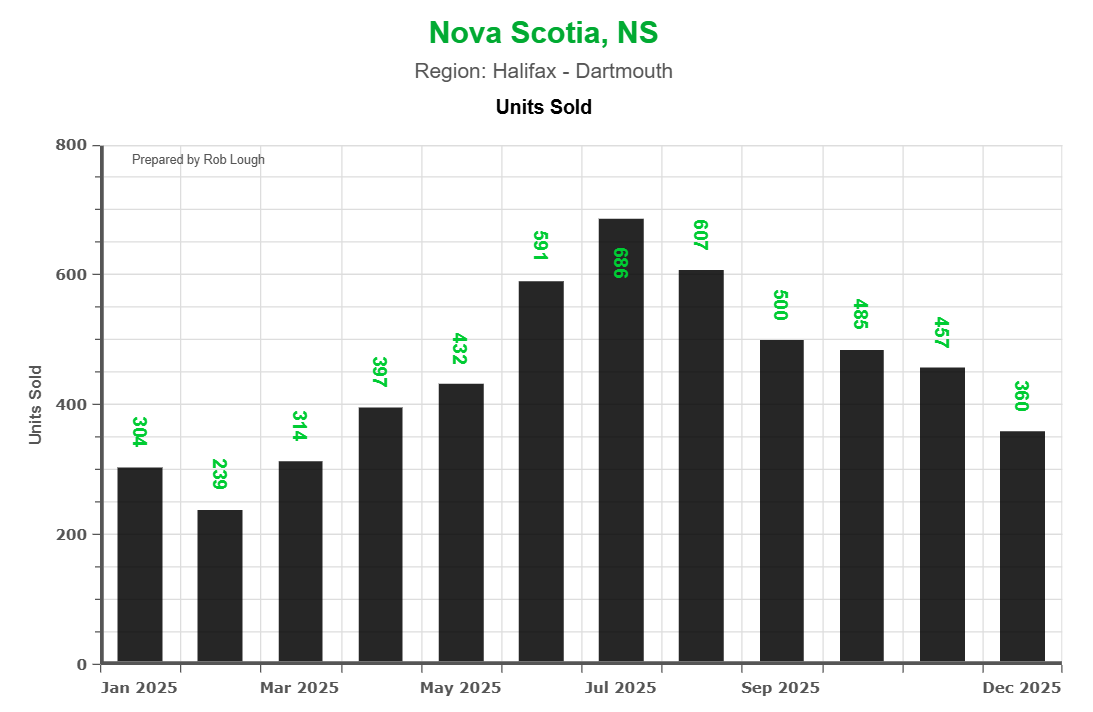
Bar chart displaying monthly residential units sold in Halifax-Dartmouth region throughout 2025. February shows lowest volume at 239 sales, July peaks at 696 sales, demonstrating strong spring-summer market activity. Chart prepared by Rob Lough.
Spring awakening arrived on schedule, with March climbing to 314 sales, April reaching 397, and May hitting 432 as both buyers and sellers returned to active market participation. Summer dominance was undeniable, with June recording 591 transactions and July reaching the year’s absolute peak at 696 sales. August maintained robust momentum with 607 units before the traditional fall slowdown began.
September saw 500 sales, October recorded 483, November dropped to 457, and December closed the year at 350 transactions—still respectable but clearly reflecting the seasonal retreat that characterizes year-end market activity. For those considering buying or selling in Halifax-Dartmouth, understanding these volume patterns is crucial for strategic timing decisions.

Bar chart showing monthly total value of real estate sales in Halifax-Dartmouth region for 2025. Values range from $178M in January to peak of $420M in July, with clear spring-summer surge and fall-winter decline. Chart prepared by Rob Lough.
Total dollar volume mirrored these transaction patterns. July’s 696 sales generated approximately $420.3 million in total real estate value—the highest monthly figure of the year. Even slower months maintained substantial economic impact, with December’s 350 sales producing $216.4 million in total value. This concentration of activity during spring and summer months is consistent with historical Maritime market patterns.
Marketing Time and Absorption Rates
Average days on market served as one of 2025’s most revealing indicators of market conditions. Properties listed during winter months spent considerably longer on market—averaging 43.4 days in January, peaking at 52.2 days in February, and remaining in the mid-40s through March. This extended marketing period reflected reduced buyer urgency and more measured decision-making during the coldest months.
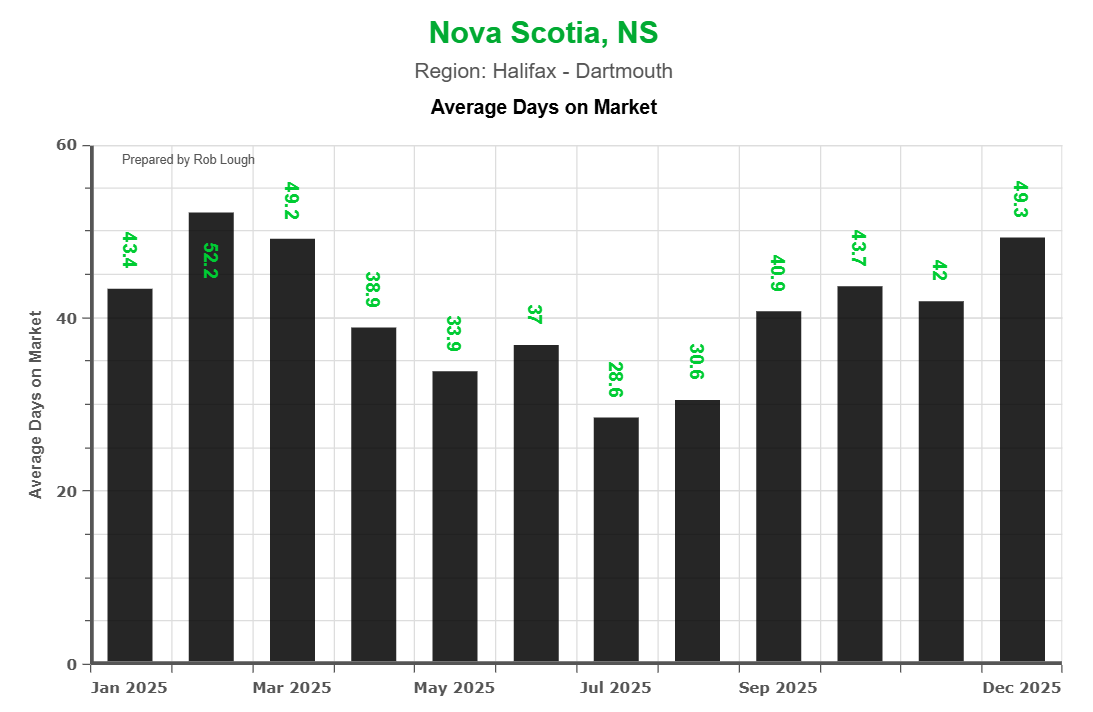
Bar chart tracking average days on market for Halifax-Dartmouth homes sold in 2025. Properties sold fastest in July at 28.6 days, slowest in February at 52.2 days, showing clear seasonal absorption patterns. Chart prepared by Rob Lough.
As temperatures rose, so did market velocity. Days on market dropped to 38.9 in April, 33.9 in May, and 37 in June before reaching the year’s fastest pace of just 28.6 days in July. This rapid absorption during peak season created intense competition among buyers and contributed to the over-asking sales environment that characterized mid-2025.
Fall brought more balanced conditions, with average DOM climbing back to 31.6 days in August, 40.9 in September, 43.7 in October, and 42 in November before reaching 49.3 days by December. These extended marketing periods provided buyers more time for thorough property inspections and due diligence—a stark contrast to the rapid-fire decision-making required during summer’s competitive environment.
Pricing Power and Negotiating Dynamics
The sold-to-ask ratio throughout 2025 provides fascinating insights into relative negotiating power between buyers and sellers. Winter and early spring saw ratios hovering just below 100%, with January at 99.3%, February at 98.5%, and March at 99.3%—indicating that most properties sold slightly below asking price with some room for buyer negotiation.
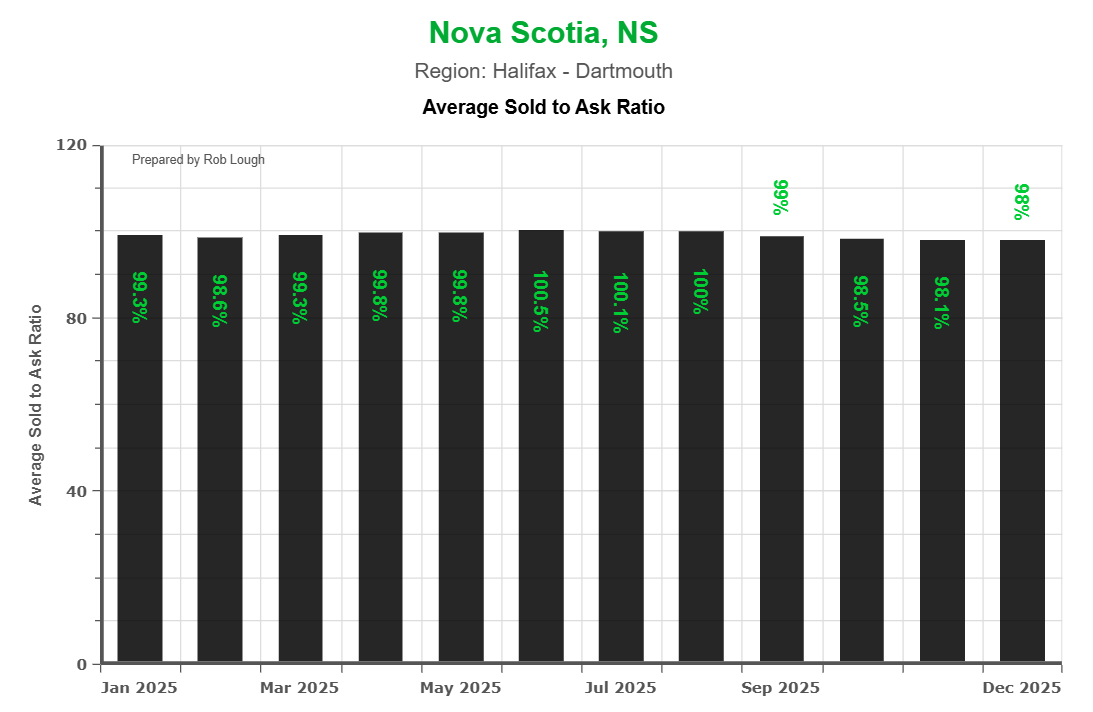
Bar chart showing average sold-to-ask price ratios for Halifax-Dartmouth real estate in 2025. Ratios remain between 98.5% and 100.1% throughout the year, with slight peaks in summer months indicating sellers consistently achieved near or above asking prices.
Market momentum built through spring, with April reaching 99.8% and May hitting an even 100%. The summer peak pushed ratios to 100.5% in June and 100.1% in both July and August—clear evidence that buyers were consistently meeting or exceeding list prices during peak competition. Multiple-offer situations became common during these months, with desirable properties often receiving several competing bids.
Fall moderation brought ratios back to more balanced territory, with September at 99%, October at 98.5%, and December finishing at 99%. While this represented cooling from summer peaks, these ratios still demonstrated strong pricing power for sellers compared to more buyer-favorable markets elsewhere in Canada. Properties priced appropriately continued achieving near-asking prices even during traditionally slower months.
Price and Volume Relationship
One of the most instructive charts in the 2025 dataset shows the relationship between average prices and units sold across the year. The dual-axis visualization clearly demonstrates that while transaction volume varied dramatically by season, pricing remained remarkably stable.
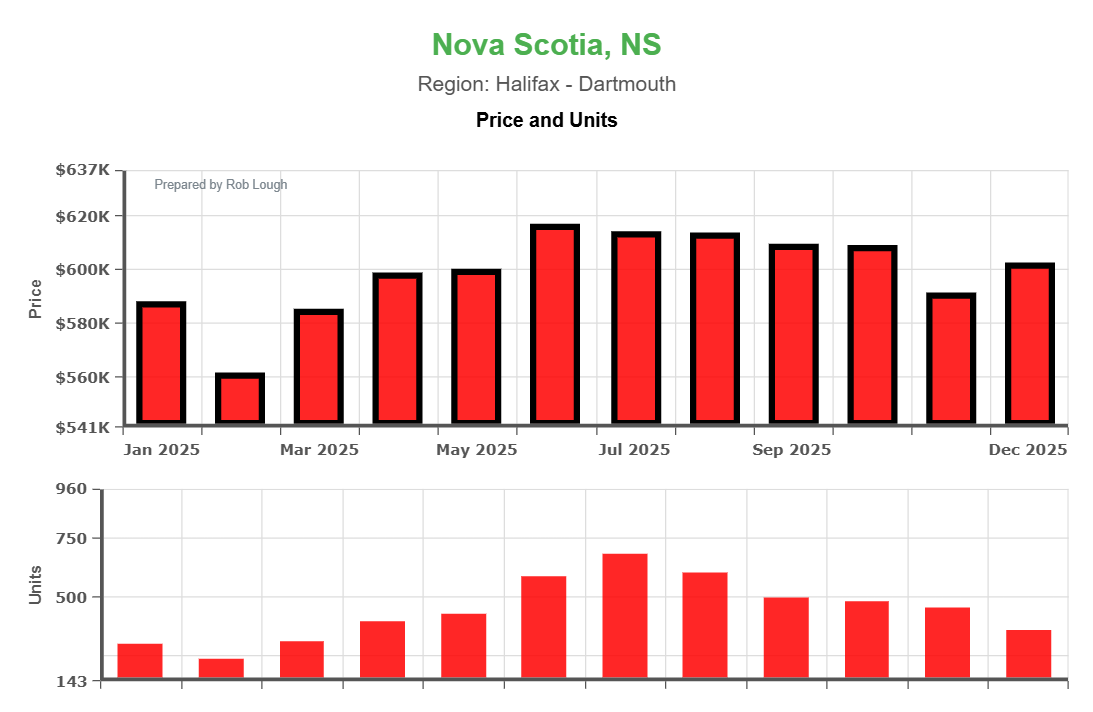
Dual bar chart comparing average home prices and units sold in Halifax-Dartmouth 2025. Top chart shows prices ranging from $560K-$615K with relatively stable trend. Bottom chart shows units sold ranging from 230-690 with clear seasonal peak in summer months.
This divergence between volume and price is significant. In speculative or overheated markets, high volumes often correspond with rapidly rising prices, while declining volumes trigger price corrections. Halifax-Dartmouth showed neither pattern—instead maintaining steady pricing regardless of transaction pace. This suggests the market is driven by fundamental supply-demand dynamics rather than speculation or irrational exuberance.
For real estate investors evaluating multi-unit financing options or considering rental property acquisitions, this price stability provides confidence in long-term value appreciation and reduces concerns about market timing.
Strategic Insights for Buyers
Buyers navigating the Halifax-Dartmouth market should consider several data-driven insights:
Timing flexibility provides significant advantages. Those able to purchase during fall or winter months encountered less competition, gained modest negotiating leverage, and enjoyed 15-25 additional days for thorough due diligence compared to summer buyers. However, winter buyers also faced more limited inventory selection, requiring patience to find the right property.
Summer purchases demanded different strategies. Buyers committed to peak-season acquisitions needed pre-arranged financing, immediate decision-making capability, and competitive offer strategies. The 28-day average DOM during July meant desirable properties often received multiple offers within the first week of listing. Successful summer buyers typically had mortgage pre-approval secured before beginning their search.
The consistent 98-100% sold-to-ask ratios throughout 2025 mean that lowball offers rarely succeeded in this market. Properties priced appropriately for their condition and location typically sold at or near asking price regardless of season. Buyers benefit from working with knowledgeable agents who understand comparative market analysis and can guide realistic offer strategies.
Budget planning should account for the $602,000 average price level, though significant variation exists by neighborhood and property type. Understanding closing costs when buying in Nova Scotia is essential for accurate budget preparation, as additional expenses beyond the purchase price can add 1.5-4% to total acquisition costs.
Strategic Insights for Sellers
Sellers can leverage several key findings from the 2025 data:
Spring-summer listing timing maximizes multiple advantages simultaneously. Properties hitting the market between April and August sold 15-20 days faster on average than winter listings, achieved asking price or better more consistently, and benefited from maximum buyer traffic. The combination of optimal weather for property showings, peak buyer motivation, and heightened competition creates ideal selling conditions.
However, fall and winter listings offer distinct advantages for certain situations. Reduced competition from other sellers means your property receives more focused attention from serious, motivated buyers. While you may accept slightly below asking price, you’ll typically deal with purchasers who have genuine intent rather than casual browsers or seasonal shoppers.
Pricing strategy remains paramount regardless of listing season. The data clearly shows that appropriately priced properties sold consistently throughout 2025, while overpriced listings languished even during peak months. The narrow 6% price variation across the year means there’s little room for inflated pricing expectations. Working with experienced professionals who understand current market comparables is essential for setting competitive list prices.
Property presentation deserves investment year-round. In a market where average prices exceed $600,000, buyers expect move-in ready condition and professional presentation. Addressing deferred maintenance, completing strategic updates, and ensuring strong curb appeal can justify premium pricing and accelerate sales even during slower months. Consider exploring how Halifax’s Housing Accelerator Plan might affect property values in specific neighborhoods.
Geographic Variations Within the Region
While these statistics represent the broader Halifax-Dartmouth region, individual neighborhoods and submarkets exhibited varied performance throughout 2025. Urban core areas including downtown Halifax, the Halifax Peninsula, and central Dartmouth typically experienced faster sales and higher sold-to-ask ratios than suburban communities farther from urban centers.
Waterfront properties commanded significant premiums regardless of specific location. Whether in Eastern Passage, Bedford Basin, or Dartmouth’s lake communities, water-view and water-access properties attracted strong buyer interest year-round, often receiving multiple offers even during traditionally slower months. The lifestyle appeal of Maritime coastal living continues driving demand for these premium properties.
Emerging neighborhoods and areas adjacent to major development projects attracted investor and owner-occupier interest due to perceived value and future appreciation potential. Established suburban communities offered larger property selection and slightly extended marketing times but maintained stable pricing throughout the year.
For detailed property tax information that varies significantly by municipality within the region, review our guide to property taxes in Nova Scotia to understand the full cost of ownership in different areas.
Market Comparison and Historical Context
The approximate 4% year-over-year price appreciation from 2024 to 2025 represents healthy but moderate growth. This stands in stark contrast to the double-digit annual gains experienced during the 2020-2022 pandemic boom, suggesting the market has successfully transitioned to more sustainable, long-term growth patterns.
Transaction volumes remained robust by historical standards while not matching the frenzied pace of peak pandemic years. The 5,000+ total sales across the region throughout 2025 confirms Halifax-Dartmouth’s position as consistently one of Atlantic Canada’s most active real estate markets, attracting both local upgraders and out-of-province buyers seeking relocation opportunities.
The shift from pandemic-era volatility to predictable seasonal patterns represents market maturation. Buyers and sellers can now plan transactions with reasonable confidence about what to expect during different times of year—a significant improvement over the unpredictable conditions that characterized 2020-2022.
Economic and Demographic Context
Several factors beyond pure real estate metrics contributed to Halifax-Dartmouth’s 2025 performance. The region’s diversified economy, anchored by government services, education, healthcare, defense, and growing technology sectors, provides stable employment that supports housing demand.
Continued population growth through both interprovincial and international migration sustained buyer demand throughout the year. Halifax’s appeal to remote workers, retirees seeking lower cost of living than central Canada, and international immigrants attracted by Atlantic immigration programs all contributed to steady housing absorption.
Limited new construction relative to population growth kept inventory constrained, supporting price stability even during seasonal volume declines. While development activity increased compared to previous years, it remained insufficient to significantly alter supply-demand fundamentals in the established housing market.
Looking Ahead to 2026
The 2025 Halifax-Dartmouth market data suggests several likely trends for 2026. The combination of steady pricing, predictable seasonal patterns, and balanced sold-to-ask ratios indicates neither an overheated market at risk of correction nor a soft market signaling decline.
Several factors support continued stability heading into the new year. Halifax’s economic fundamentals remain strong, population growth continues through multiple channels, and housing supply relative to demand remains constrained. While mortgage regulations and interest rate policy will influence buyer qualification and affordability, they’re unlikely to dramatically shift overall market dynamics absent major economic disruption.
The seasonal patterns demonstrated throughout 2025 will almost certainly persist, with spring-summer peaks and fall-winter moderation remaining the norm. Buyers and sellers who understand these rhythms and plan their transactions accordingly will continue achieving optimal outcomes. For those exploring getting pre-approved for a mortgage, beginning the process 60-90 days before your target purchase date ensures you’re positioned to act when the right property appears.
Practical Application of Market Data
Understanding market statistics is valuable only when translated into actionable strategies. For buyers planning 2026 purchases, beginning your property search 60-90 days before your desired possession date accounts for typical marketing times plus 30-60 day closing periods. Securing mortgage pre-approval early strengthens your negotiating position when submitting offers.
For sellers planning 2026 listings, timing your market entry for late March through early May positions you at the beginning of peak season when buyer motivation is highest but inventory hasn’t yet reached summer saturation. This sweet spot often generates maximum competition with optimal pricing results.
For real estate investors evaluating acquisition opportunities, the price stability demonstrated throughout 2025 reduces market timing risk. Whether purchasing in February or July, you’re likely to pay similar prices—allowing you to focus on property fundamentals and income potential rather than attempting to time market cycles. Understanding apartment construction financing options can unlock opportunities in the multi-unit space.
The Importance of Professional Guidance
While market statistics provide valuable context, they represent averages and trends rather than certainties for individual transactions. Every property is unique, every buyer’s situation differs, and every seller’s goals vary. Successful real estate outcomes result from combining market knowledge with property-specific analysis and personalized strategy.
Working with experienced local professionals who understand neighborhood nuances, property valuation, negotiation dynamics, and transaction processes remains essential for optimal results. Market data informs decisions but doesn’t replace the judgment and expertise that comes from years of hands-on experience in specific local markets.
For those navigating financing complexities, understanding the difference between bank appraisals and real estate CMAs can prevent surprises during the approval process and help set realistic expectations.
Conclusion: A Market Finding Its Equilibrium
The 2025 Halifax-Dartmouth real estate market delivered what most participants hope for: stability, predictability, and healthy appreciation without excessive volatility. Average prices around $602,000 represent fair market value supported by strong fundamentals, while seasonal volume fluctuations provided opportunities for both aggressive spring-summer transactions and more measured fall-winter decision-making.
The transition from pandemic-era unpredictability to sustainable, seasonal patterns represents positive market evolution. Whether buying your first home, selling to upsize or downsize, or building a real estate investment portfolio, Halifax-Dartmouth offers a balanced environment where informed participants can achieve their goals.
The key to success lies in understanding market rhythms, working with experienced professionals, and aligning your timeline with market conditions that favor your specific objectives. The 2025 data provides the roadmap—now it’s about applying these insights to your unique situation and goals for 2026 and beyond.
For personalized guidance navigating the Halifax-Dartmouth real estate market based on your specific needs and timeline, contact Rob Lough at Century 21 Optimum Realty to discuss your goals and develop a customized strategy for success.
Article prepared by Rob Lough, Broker/Owner/Realtor® at Century 21 Optimum Realty. With 25 years of experience (20 years as a Realtor + 5 years as a Home Inspector) serving Halifax, Dartmouth, and surrounding HRM communities, Rob provides expert guidance for buyers, sellers, and investors throughout the region.
Related Resources
- Halifax-Dartmouth Real Estate Home Search
- Mortgage Payment Calculator
- Closing Costs When Buying in Nova Scotia
- Property Taxes in Nova Scotia Explained
- Understanding HRM’s Suburban Housing Accelerator
- MLI Select Program: CMHC Multi-Unit Financing Guide
- Bank Appraisal vs Real Estate CMA in Nova Scotia
- About Rob Lough – Experience & Background

