
 Facebook
 X
X
 Pinterest
 Copy Link
District 104 Real Estate Analysis: What 2025 Data Reveals About Truro, Bible Hill, and Stewiacke
By Rob Lough, Broker/Owner at Century 21 Optimum Realty
When the final transaction closed in December 2025, District 104—encompassing Truro, Bible Hill, and Stewiacke—had delivered exactly what central Nova Scotia buyers and sellers had come to expect: consistency, predictability, and steady returns. While headline-grabbing markets like Halifax saw volatility throughout the year, this corridor maintained its reputation as one of the province’s most stable real estate environments.
The numbers tell a story worth understanding, whether you’re weighing a 2026 purchase, considering listing your property, or simply tracking where your home’s value is headed. Let’s break down what actually happened in this market over the past twelve months.
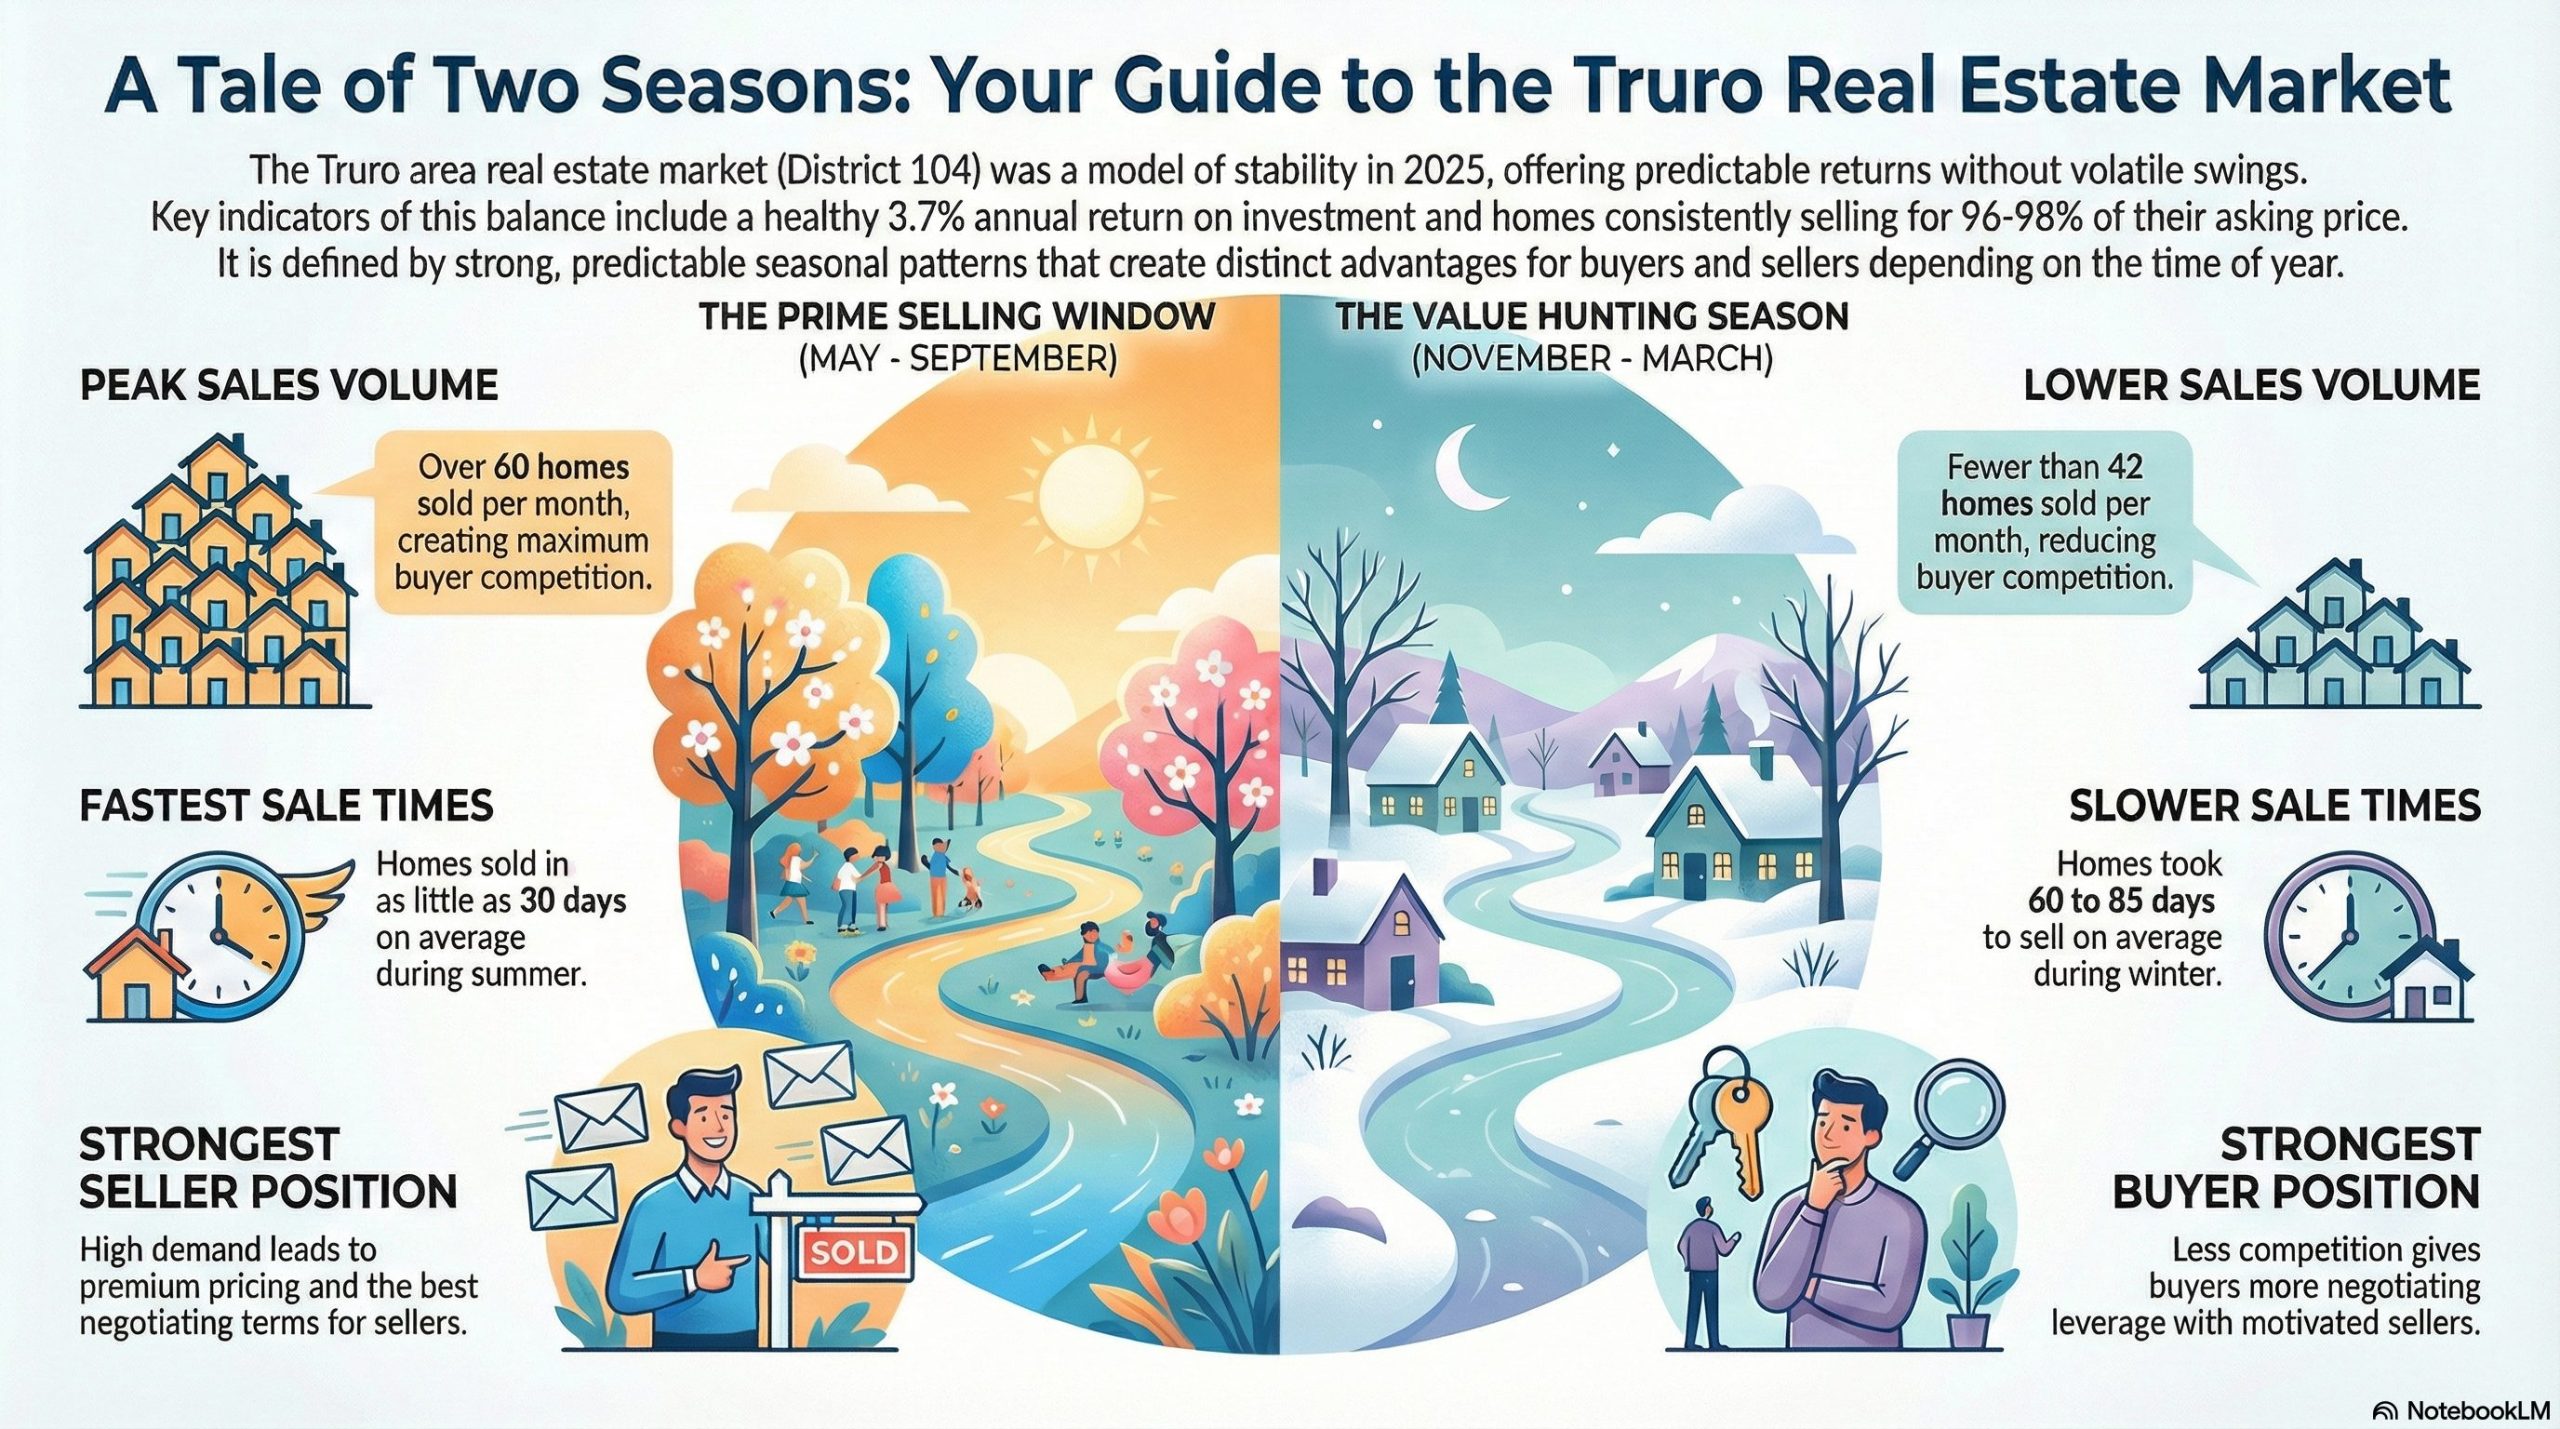
The Big Picture: A 3.7% Return in a Balanced Environment
Real estate investors and homeowners often fixate on dramatic percentage gains, but District 104’s 3.7% annual return on investment represents something arguably more valuable: sustainable, predictable appreciation. This isn’t the kind of market that makes you rich overnight—it’s the kind that builds wealth steadily over decades.
Average home prices started 2025 near $340,000 and finished around $353,000. That $13,000 gain might not sound extraordinary until you consider it came without the wild swings that left homeowners in other markets wondering if they’d bought at a peak or were watching their equity evaporate.
The stability here matters for several reasons. Understanding property valuation becomes easier when markets aren’t whipsawing month to month. Mortgage qualification remains consistent when lenders can reliably project future values. And stress levels stay manageable when you’re not constantly second-guessing your timing.
For context, this kind of steady growth historically outpaces inflation while avoiding the corrections that wipe out paper gains in overheated markets. It’s the real estate equivalent of a reliable dividend stock rather than a high-flying tech play.
How Prices Actually Moved Throughout the Year
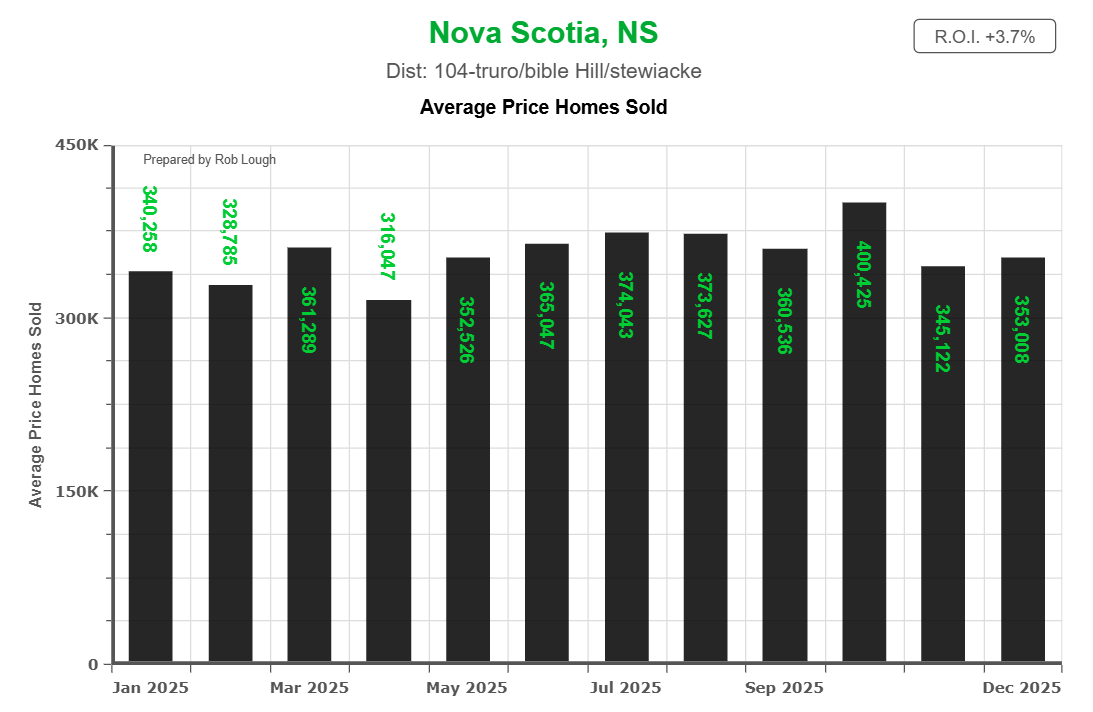
Monthly average home sale prices for Truro Bible Hill Stewiacke District 104 in 2025, starting at $340K in January, dipping to $316K in April, peaking at $400K in October, ending at $353K in December, reflecting 3.7% year-over-year return
The monthly progression of average sale prices reveals the market’s true character. January’s $340,256 average represented a typical winter starting point, when buyers and sellers are still gauging the year ahead.
April brought an interesting dip to approximately $316,047—the year’s low point. This wasn’t a crash or even a correction in the traditional sense. Rather, it reflected a surge of entry-level inventory hitting the market as spring sellers who’d prepared through winter finally listed. When more affordable homes make up a larger percentage of transactions, the average naturally drops without indicating any systemic weakness.
Summer pricing climbed steadily as move-up buyers entered the market and competition increased. By October, the average had peaked near $400,000—a healthy 18% above the April low. This October surge wasn’t speculative fever; it reflected the combination of seasonal demand, the strongest properties coming to market, and buyers willing to stretch budgets to secure homes before winter.
December’s retreat to approximately $353,000 completed the cycle as the market shifted back to its baseline, with year-end pricing settling modestly above where January began.
What Sellers Should Know: Your listing’s timing relative to these seasonal patterns directly impacts not just how quickly you’ll sell, but the price you’ll ultimately receive. A well-prepared home listed in late April or early May captures rising demand without competing with the peak inventory months that follow.
What Buyers Should Know: Getting pre-approved early allows you to act during the windows when pricing dips—particularly that March-April period when inventory increases faster than buyer demand. Miss that window, and you’re competing through summer when prices peak.
Transaction Volume: Reading the Market’s Pulse
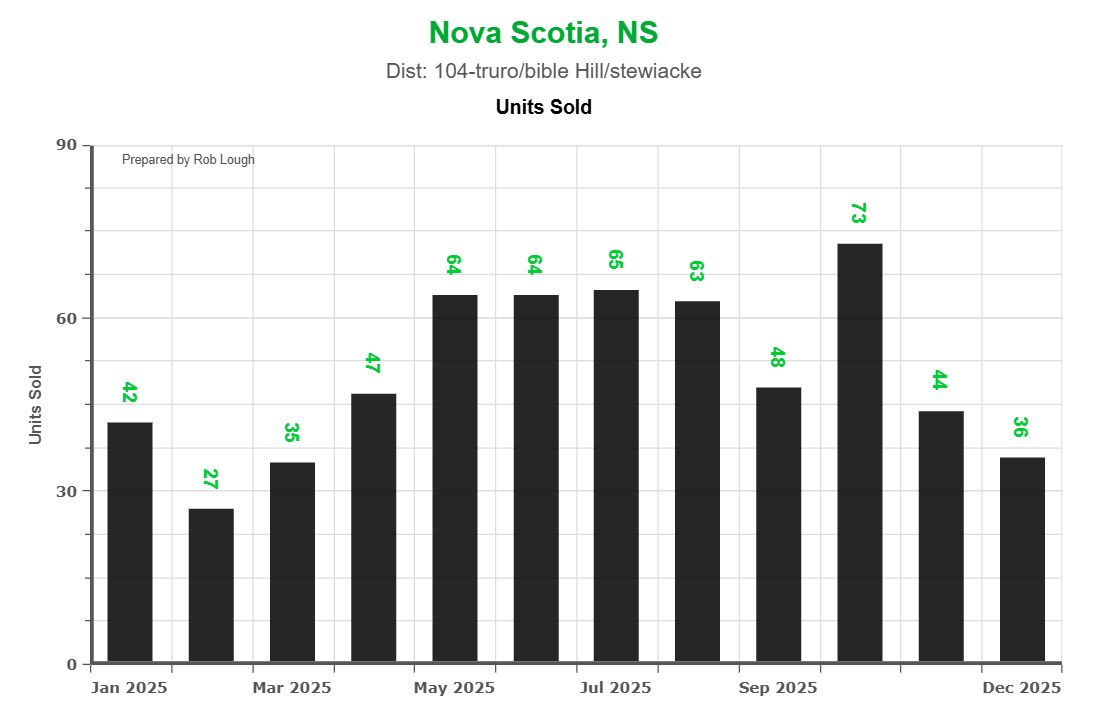
Monthly residential real estate transactions in Truro Nova Scotia area for 2025, showing winter low of 27 sales in February rising to fall peak of 73 sales in October, prepared by Rob Lough Realtor
While prices tell you what properties cost, transaction volume reveals market confidence and momentum. District 104’s 2025 volume pattern followed the predictable Nova Scotia arc, but the specific numbers matter.
January’s 42 sales reflected the deep winter slowdown when only motivated buyers and sellers engage. By May, that number had climbed to 64 as the spring market gained traction—a 52% increase that demonstrates the seasonal shift’s magnitude.
The summer plateau, with sales consistently in the 60s from June through August, represents the market’s sustained peak activity period. This isn’t just more transactions—it’s faster sales, more competition, and different negotiating dynamics.
October’s 73 sales marked the year’s absolute peak, representing that final pre-winter push from buyers who don’t want to search through December and sellers who hope to close before the holidays. Then the December drop to 36 sales completed the cycle, returning to that quiet baseline where the market essentially hibernates until spring.
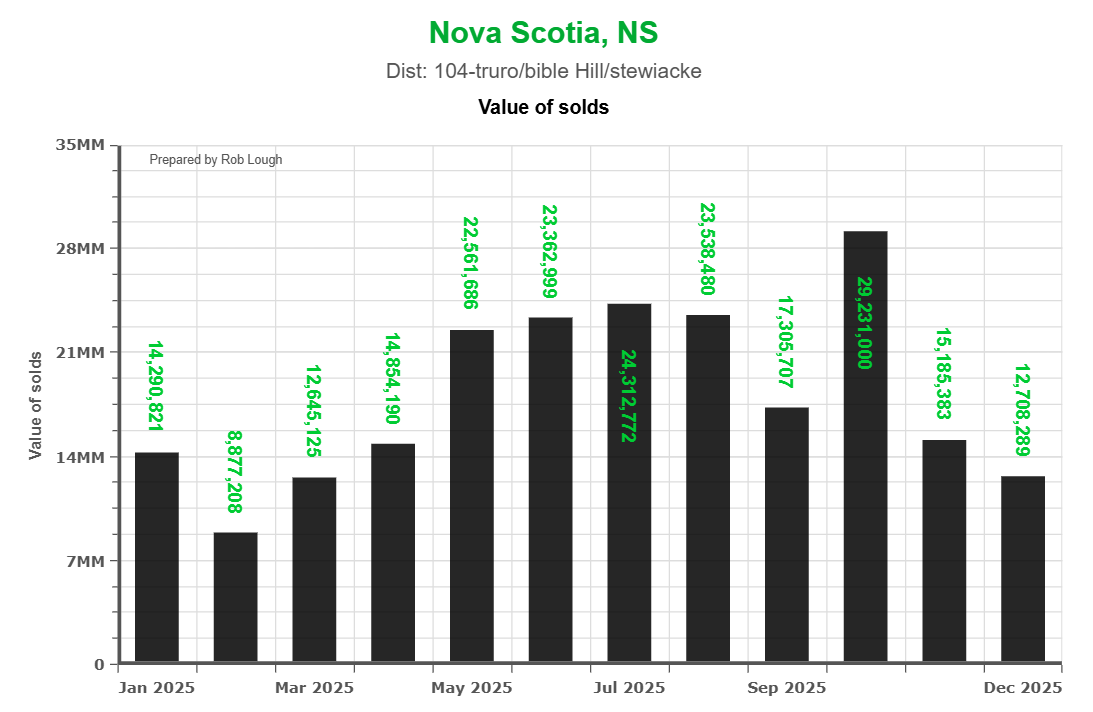
Monthly real estate sales volume in dollars for Truro Bible Hill Stewiacke area 2025, showing seasonal pattern with lowest sales value of $8.9M in February and highest of $29.2M in October, prepared by Rob Lough
The total value of sales—essentially the monthly volume multiplied by average prices—swung even more dramatically. From $14.3 million in January to nearly $29.2 million in October represents a doubling of market activity that has implications beyond simple statistics.
For the local economy, these surges drive everything from home inspection services to moving companies to furniture retailers. For sellers, they represent windows where your property competes for attention from the maximum possible buyer pool. For buyers, they indicate periods where negotiating leverage shifts decidedly toward sellers.
Days on Market: The Velocity Metric That Matters
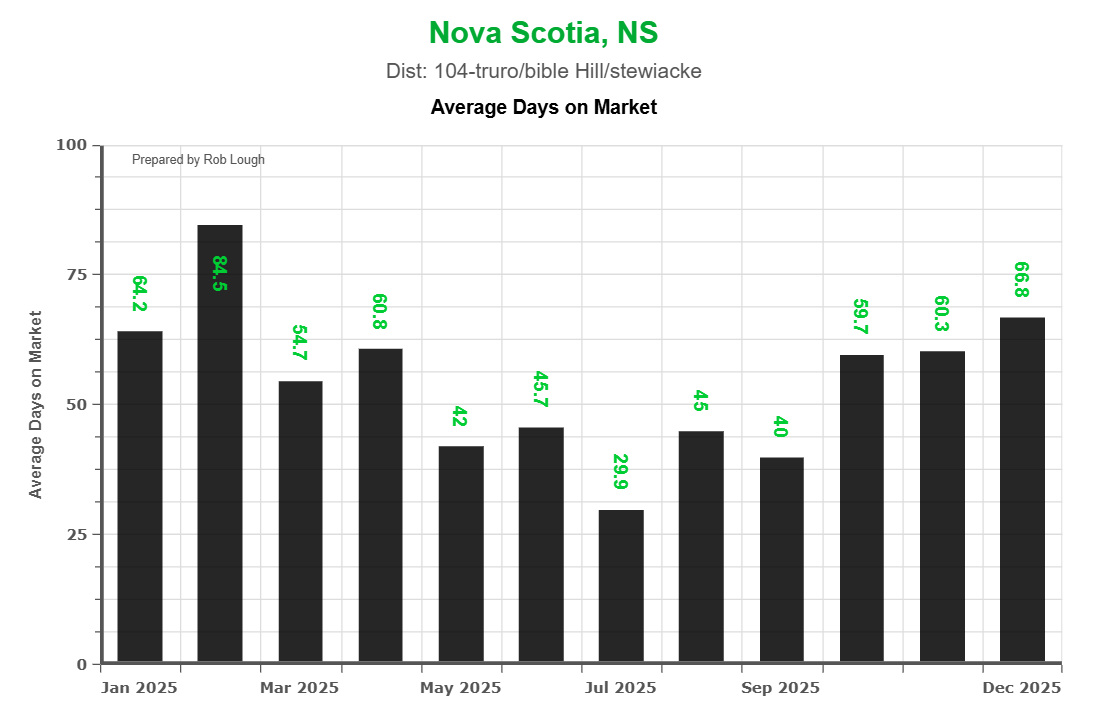
Monthly average days on market for District 104 Truro real estate 2025, illustrating seasonal velocity with winter high of 84.5 days in February declining to summer low of 29.9 days in July before rising to 66.8 days in Decembe
If you want to understand a market’s real dynamics, ignore the headlines and watch days on market. This metric cuts through spin and reveals whether buyers are hunting aggressively or window-shopping cautiously.
District 104 started the year at 64.2 days on market in January—a respectable pace that suggests properly priced homes found buyers within two months. February’s spike to 84.5 days reflected the annual winter low point, when even excellent properties can linger as buyer traffic drops to a trickle.
But then spring arrived and everything accelerated. By July, average days on market had plummeted to just 29.9 days. Think about what this means practically: a home listed on July 1st was statistically likely to have an accepted offer by month-end. This is competitive market behavior—buyers touring immediately, making fast decisions, and coming in with strong offers to avoid losing to competition.
The climb back to 66.8 days by December completed the seasonal arc, but that summer low point is the metric worth remembering. When homes are selling in 30 days, there’s no room for “testing the market” with optimistic pricing or waiting to stage properly. Buyers are moving decisively, and sellers who aren’t ready lose opportunities.
What This Means for 2026 Sellers: If you’re planning a summer listing, your preparation timeline needs to account for this velocity. Homes need to be market-ready before listing, because the first two weeks—and especially the first weekend—will likely determine your success. Understanding what drives property value helps you focus on improvements that actually matter to buyers.
What This Means for 2026 Buyers: Those 30-day summer windows mean your financing, inspection, and decision-making processes need to be ready before you start touring. By the time you’ve spent two weeks deciding whether you like a property, someone else has already bought it. Get your mortgage pre-approval squared away and understand how GDS and TDS ratios affect your buying power before you tour your first home.
The Sold-to-Ask Ratio: Proof of Market Balance
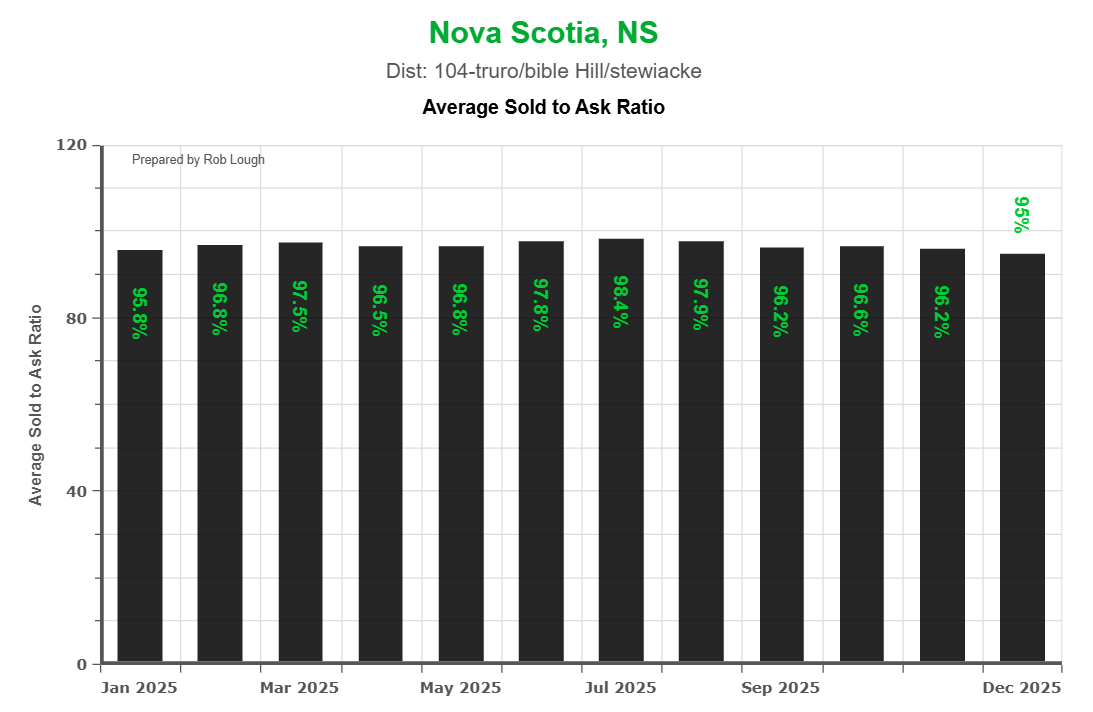
Monthly sold-to-list price ratios for District 104 Truro Bible Hill Stewiacke real estate market 2025, demonstrating stable market with all months between 95.8% and 98.5%, indicating balanced buyer-seller dynamics”
Markets reveal their true character through the sold-to-ask ratio—the percentage of list price that properties actually sell for. District 104’s consistency here is remarkable: every single month stayed between 95% and 98.4%.
January opened at 95.8%, December closed at 95%, and the months between showed only minor variation. This tight clustering proves several important points about how this market functions.
First, sellers are pricing realistically. Unlike markets where everyone lists 10-15% high hoping to negotiate down, District 104 sellers and their agents understand that accurate pricing generates more activity and better outcomes.
Second, buyers aren’t playing lowball games. The persistent 95-98% range means buyers recognize that properties are generally priced appropriately and come prepared to pay near asking for homes that meet their needs.
Third, the market isn’t experiencing the bidding war dynamics that push ratios above 100% in overheated environments. When you see sold-to-ask ratios of 105% or 110%, that’s often a warning sign of unsustainable speculation. District 104’s consistent sub-100% ratios indicate healthy equilibrium.
Strategic Implications for Sellers: Price accurately from day one. The market consistently proves that properties sell for 95-98% of list, which means overpricing by $20,000 in hopes of negotiating down doesn’t work here—it just costs you weeks on market and positions your home as stale inventory when you eventually reduce.
Strategic Implications for Buyers: Prepare to pay near asking price for properties you actually want. If you see a home listed at $365,000 that meets your needs, offering $320,000 isn’t “negotiating”—it’s wasting everyone’s time. Realistic negotiations in this market might involve $5,000-$10,000 off list, contingency removals, or closing date flexibility, not 12% discounts.
Seasonality: The Pattern You Can Bank On
One of District 104’s most valuable characteristics for strategic buyers and sellers is its predictability. The 2025 data didn’t just confirm seasonal patterns—it reinforced them with remarkable consistency.
Winter (December-February): These months represent the market’s lowest volume, longest days on market, and softest pricing. Transaction counts drop into the 27-42 range, days on market stretch to 60-85 days, and pricing settles at year-lows. This is when motivated sellers who can’t wait for spring meet bargain-hunting buyers willing to brave the cold for deals.
Spring (March-May): The market awakens gradually, with volume climbing from the 40s into the 60s, days on market shortening to the 45-60 day range, and pricing firming as competition increases. This transitional period offers interesting opportunities for both sides—sellers face less inventory competition than summer peak, while buyers find more choices than winter offered.
Summer (June-August): Peak season delivers consistent 60+ transactions monthly, days on market in the 30-45 day range, and pricing power shifting decisively to sellers. This is when properly prepared homes sell quickly at strong prices, but it’s also when poorly prepared inventory can languish despite the traffic.
Fall (September-November): The final push before winter brings October’s transaction peak (73 sales), continued quick days on market (40-60 days), and strong pricing as buyers rush to secure homes before winter. This represents a last chance for sellers to capture competitive market dynamics before the December slowdown.
What District 104 Offers That Halifax Doesn’t
While much attention focuses on Halifax Regional Municipality’s market dynamics, District 104 offers several compelling alternatives worth understanding.
Affordability: The $340,000-$400,000 range that characterized most of 2025 in District 104 would barely open the door to entry-level townhomes in many Halifax neighborhoods. That $150,000-$200,000 price differential buys substantially more house—often detached single-family homes rather than condos or townhouses.
Stability: Halifax’s market experienced notably sharper swings in 2025, with certain neighborhoods seeing rapid appreciation followed by corrections. District 104’s steadier path delivered less excitement but also less risk—a trade-off that appeals to buyers prioritizing security over speculation.
Commutability: The approximately one-hour commute to downtown Halifax remains feasible for many workers, particularly in the hybrid work era where daily commuting is less common. Understanding regional housing programs can help buyers maximize affordability when considering locations beyond Halifax proper.
Quality of Life: Truro’s smaller-city character, Bible Hill’s established neighborhoods, and Stewiacke’s rural accessibility offer lifestyle benefits that urban buyers often discover they’re willing to pay for—or rather, willing to commute for.
Market Predictability: The consistent seasonal patterns make strategic timing more straightforward here than in markets where unpredictable factors create volatility. You can plan a purchase or sale around District 104’s rhythm with reasonable confidence.
The Investment Case for District 104
Beyond personal homeownership, District 104 presents a compelling investment thesis for buy-and-hold real estate investors. Several factors combine to create this opportunity:
Rental Demand Fundamentals: NSCC’s Truro campus, regional healthcare facilities, and manufacturing operations in Debert create consistent rental demand across price points. Unlike investment markets dependent on tourism or speculative development, District 104’s rental demand stems from employment and education—more stable drivers.
Appreciation Without Speculation: That 3.7% annual ROI compounds over time while avoiding the corrections that plague markets built on speculation. A property purchased at $340,000 in 2020 would be worth approximately $410,000 today at that pace—without the stress of wondering if a bubble would burst.
Cash Flow Potential: Purchase prices in the $300,000s combined with Truro-area rents often produce better cash flow than similar strategies in Halifax, where higher purchase prices can make positive cash flow elusive even with premium rents.
Market Timing Advantage: The predictable seasonality allows savvy investors to time purchases for maximum value—buying during winter slowdowns and either selling during peaks or holding for rental income.
Diversification Value: For investors already exposed to Halifax real estate, District 104 provides geographic diversification while remaining within reasonable management distance.
Positioning for 2026: Practical Strategy
As we move into 2026, several factors suggest District 104 will maintain its stable trajectory while presenting specific opportunities for prepared buyers and sellers.
Interest Rate Environment: Whether rates continue declining or stabilize, District 104’s relatively affordable pricing means buyers face less qualification risk than in higher-priced markets. Understanding mortgage qualification becomes particularly important as rule changes continue reshaping the lending landscape.
Halifax Spillover: Continued affordability pressures in HRM will likely maintain demand flow toward District 104, particularly from first-time buyers and young families prioritizing space over location.
Supply Dynamics: Limited new construction in the area suggests inventory will remain tight during peak months, supporting pricing while creating opportunity windows during slower seasons.
Economic Stability: Central Nova Scotia’s diversified employment base—healthcare, education, manufacturing, and services—provides more economic resilience than markets dependent on single industries.
Demographic Tailwinds: The region continues attracting young families seeking affordability and retirees downsizing from larger centers, creating balanced demand across property types.
For Sellers Planning 2026 Listings:
Start preparation now if you’re targeting spring or summer listing dates. The 30-day velocity during peak months means you won’t have time to make improvements after listing. Consider timing that captures the late April to early June window when demand is building but you haven’t yet hit peak inventory competition.
Price based on current comparable sales, not aspirational hopes. The 96-98% sold-to-ask ratio consistently punishes overpricing. Work with an agent who understands micro-market pricing nuances—Bible Hill’s established neighborhoods, Truro’s new developments, and Stewiacke’s rural properties all command different price dynamics.
Understand that while winter listings sell, they take longer and often at lower prices. If you have flexibility, waiting for spring will likely deliver faster sales at stronger prices. If you must sell in winter, price aggressively to capture the limited buyer pool actively searching.
For Buyers Planning 2026 Purchases:
Get your financing sorted immediately. Pre-approval isn’t just about knowing your budget—it’s about being ready to act when you find the right property during peak months when 30-day sales are normal. Understanding closing costs helps you budget beyond the purchase price.
Consider strategic timing based on your priorities. If you prioritize getting the best possible price and can be flexible on possession, winter shopping (December through February) historically offers more negotiating leverage. If you need to be settled before the school year and can pay closer to asking price, spring shopping (April-May) offers the best selection before competition peaks.
Don’t waste time on properties priced above your qualified amount hoping to negotiate major reductions. The sold-to-ask data proves this market doesn’t work that way. Focus your search on properly priced homes you can actually afford at 96-98% of list.
Recognize that summer touring means fast decisions. If you’re planning to shop in June, July, or August, do your neighborhood research beforehand, understand what features you’re willing to compromise on, and be prepared to make offers within days of seeing properties you like.
For Investors Evaluating District 104:
Run cash flow projections assuming 3-5% annual appreciation rather than optimistic double-digit scenarios. This conservative approach ensures properties make financial sense on fundamentals rather than speculation.
Target winter purchases when days on market extend and motivated sellers become more flexible on price and terms. The market’s predictable seasonality allows you to time entries strategically.
Focus on properties near employment centers (NSCC campus, Colchester Regional Hospital, Debert industrial park) where rental demand remains most consistent regardless of broader economic cycles.
Consider the longer-term demographic trends favoring central Nova Scotia—Halifax spillover, regional economic development, and quality-of-life migration patterns suggest sustained demand growth at manageable rates.
The Local Knowledge Advantage
While market statistics provide valuable insights, successfully navigating District 104 requires understanding the micro-markets within these broader trends. A home on Truro’s south side trades differently than one in Bible Hill’s established neighborhoods. New construction in Truro’s growing edges attracts different buyers than character properties in the historic core. Stewiacke’s rural properties appeal to lifestyle buyers with priorities unlike those shopping suburban locations.
These nuances don’t show up in area-wide statistics but dramatically impact individual transactions. Understanding which neighborhoods are appreciating faster, which property types are facing supply constraints, and which amenities buyers currently prioritize requires tracking dozens of transactions and maintaining daily contact with what’s happening on the ground.
At Century 21 Optimum Realty, we’ve built that local knowledge base across decades of transactions. Whether you’re trying to time a purchase to maximize value or wondering if now is the right moment to list, we provide the granular market intelligence that turns area-wide data into property-specific strategy.
The difference between buying at $345,000 versus $365,000 for essentially similar properties often comes down to knowing which street commands a premium and why. The difference between selling in 30 days versus 90 days frequently relates to pricing accuracy measured against comparable sales most buyers will never see but experienced agents track daily.
Final Thoughts: Embracing Market Reality
District 104’s 2025 performance won’t generate breathless headlines about markets gone wild or impending crashes. That’s precisely what makes it valuable.
This is a market where fundamentals matter, where patient investors build wealth steadily, where first-time buyers can still enter without exotic financing, and where sellers who price accurately and prepare properly find ready buyers during predictable windows.
The 3.7% ROI might not seem thrilling compared to the double-digit gains that characterized pandemic-era housing speculation, but it’s sustainable, predictable, and compounds reliably over time. The seasonal patterns might seem limiting compared to markets where anything sells instantly year-round, but they create strategic opportunities for buyers and sellers willing to time their moves intelligently.
As we move into 2026, the fundamentals supporting this market remain intact: employment diversity, affordable pricing relative to Halifax, quality-of-life appeal, and demographic trends favoring central Nova Scotia. Whether these factors will deliver another 3-5% appreciation year or something different depends on variables beyond any single market’s control—interest rates, economic conditions, and policy decisions made in Ottawa and Halifax.
What we can reasonably predict is that District 104 will continue being District 104: steady, predictable, and rewarding for buyers and sellers who understand how it works and time their moves accordingly.
Related Resources
For Buyers:
- Bank Appraisal vs Real Estate CMA in Nova Scotia
- GDS vs TDS Ratios: Mortgage Qualification Guide
- Closing Costs When Buying in Nova Scotia
- Mortgage Pre-Approval Process
For Sellers:
Market Context:
- Halifax-Dartmouth Real Estate Market Statistics 2025
- Nova Scotia’s Population Trends and Housing Markets
- Halifax Housing Construction Trends
- Canadian Mortgage Delinquency Rates
Rob Lough is a Broker/Owner and Realtor® at Century 21 Optimum Realty with over 25 years of experience in real estate, including 20 years as a Realtor and 5 years as a Home Inspector. He serves the Halifax Regional Municipality, East Hants, and Truro markets in Nova Scotia. Contact Rob at www.roblough.c21.ca or call (902) 444-1333 to discuss your real estate goals in central Nova Scotia.

