
 Facebook
 X
X
 Pinterest
 Copy Link
Halifax-Dartmouth Real Estate Market Stats: July 2026
By Rob Lough | Broker/Owner, Century 21 Optimum Realty | Halifax-Dartmouth, Nova Scotia
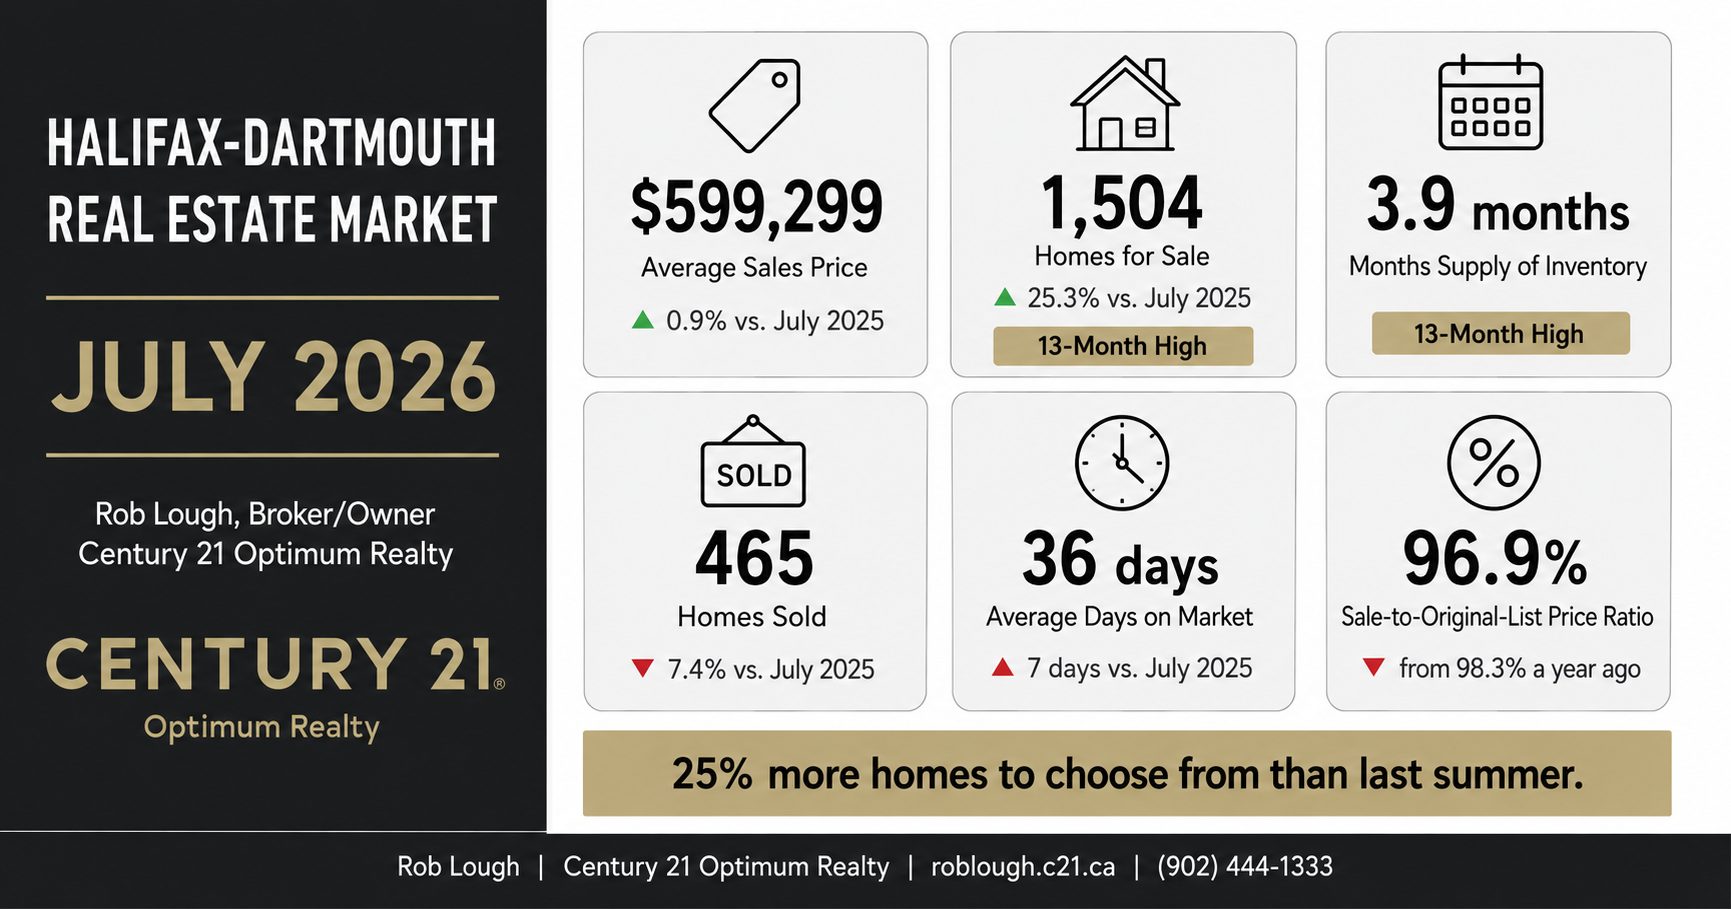
Key Takeaways: Halifax-Dartmouth, July 2026
- 465 homes sold in Halifax-Dartmouth in July 2026, down 13.1% from June and 7.4% below July 2025.
- Average sales price: $599,299, down 3.0% from June but up 0.9% year-over-year.
- Active inventory hit a 13-month high of 1,504 homes for sale, up 25.3% year-over-year.
- Months supply climbed to 3.9, another 13-month high, now at the doorstep of the 4–6 month balanced range.
- Pending sales fell to 425, down 19.5% from June — the clearest signal of a cooling late summer.
- Average days on market: 36, up from 32 in June and 29 a year ago.
- Price per square foot is up year-over-year, even as headline prices soften.
Halifax-Dartmouth’s residential market shifted gears in July 2026. After a strong spring and a solid June, sales volume pulled back meaningfully, pending sales dropped sharply, and inventory kept climbing to its highest level in over a year. This is the most balanced the market has looked in several years and for buyers, the most workable. Here’s the full breakdown of what the numbers tell us. Are you a condo owner and want to know about the Halifax Dartmouth Condo Market Report?
Total Units Sold
465 residential units sold in Halifax-Dartmouth in July 2026, down from 535 in June and 7.4% below last July’s 502 units. That’s the first meaningful step down since the spring run-up, and it breaks a four-month streak of month-over-month gains.
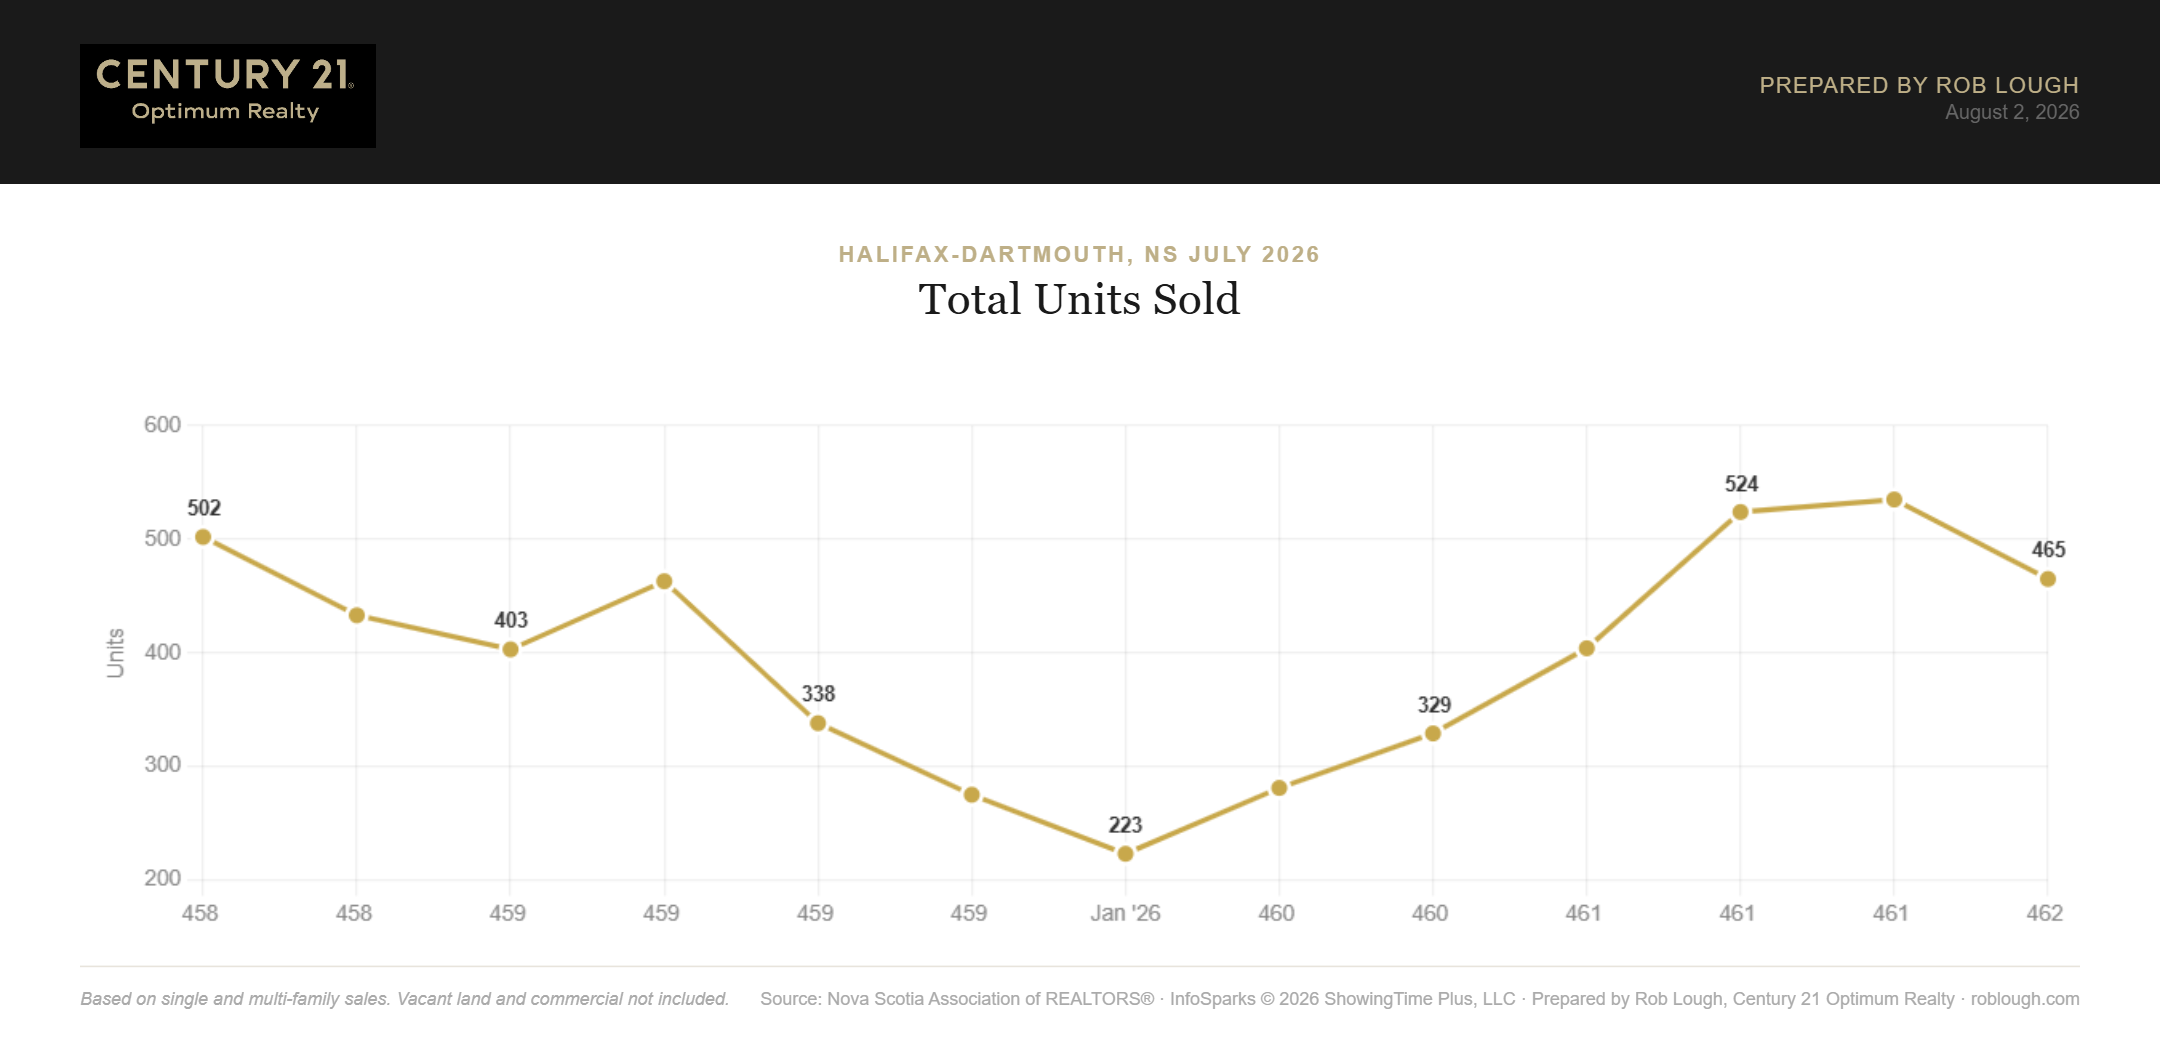
Halifax-Dartmouth Real Estate Market Stats July 2026 Number of units sold
Pending sales tell the more forward-looking story: 425 pending sales in July, down 19.5% from June’s 528 and 14.5% below July 2025’s 497. Because pending sales lead closings by roughly 30 to 60 days, this points to a softer August and September than the summer averages we’ve been seeing.
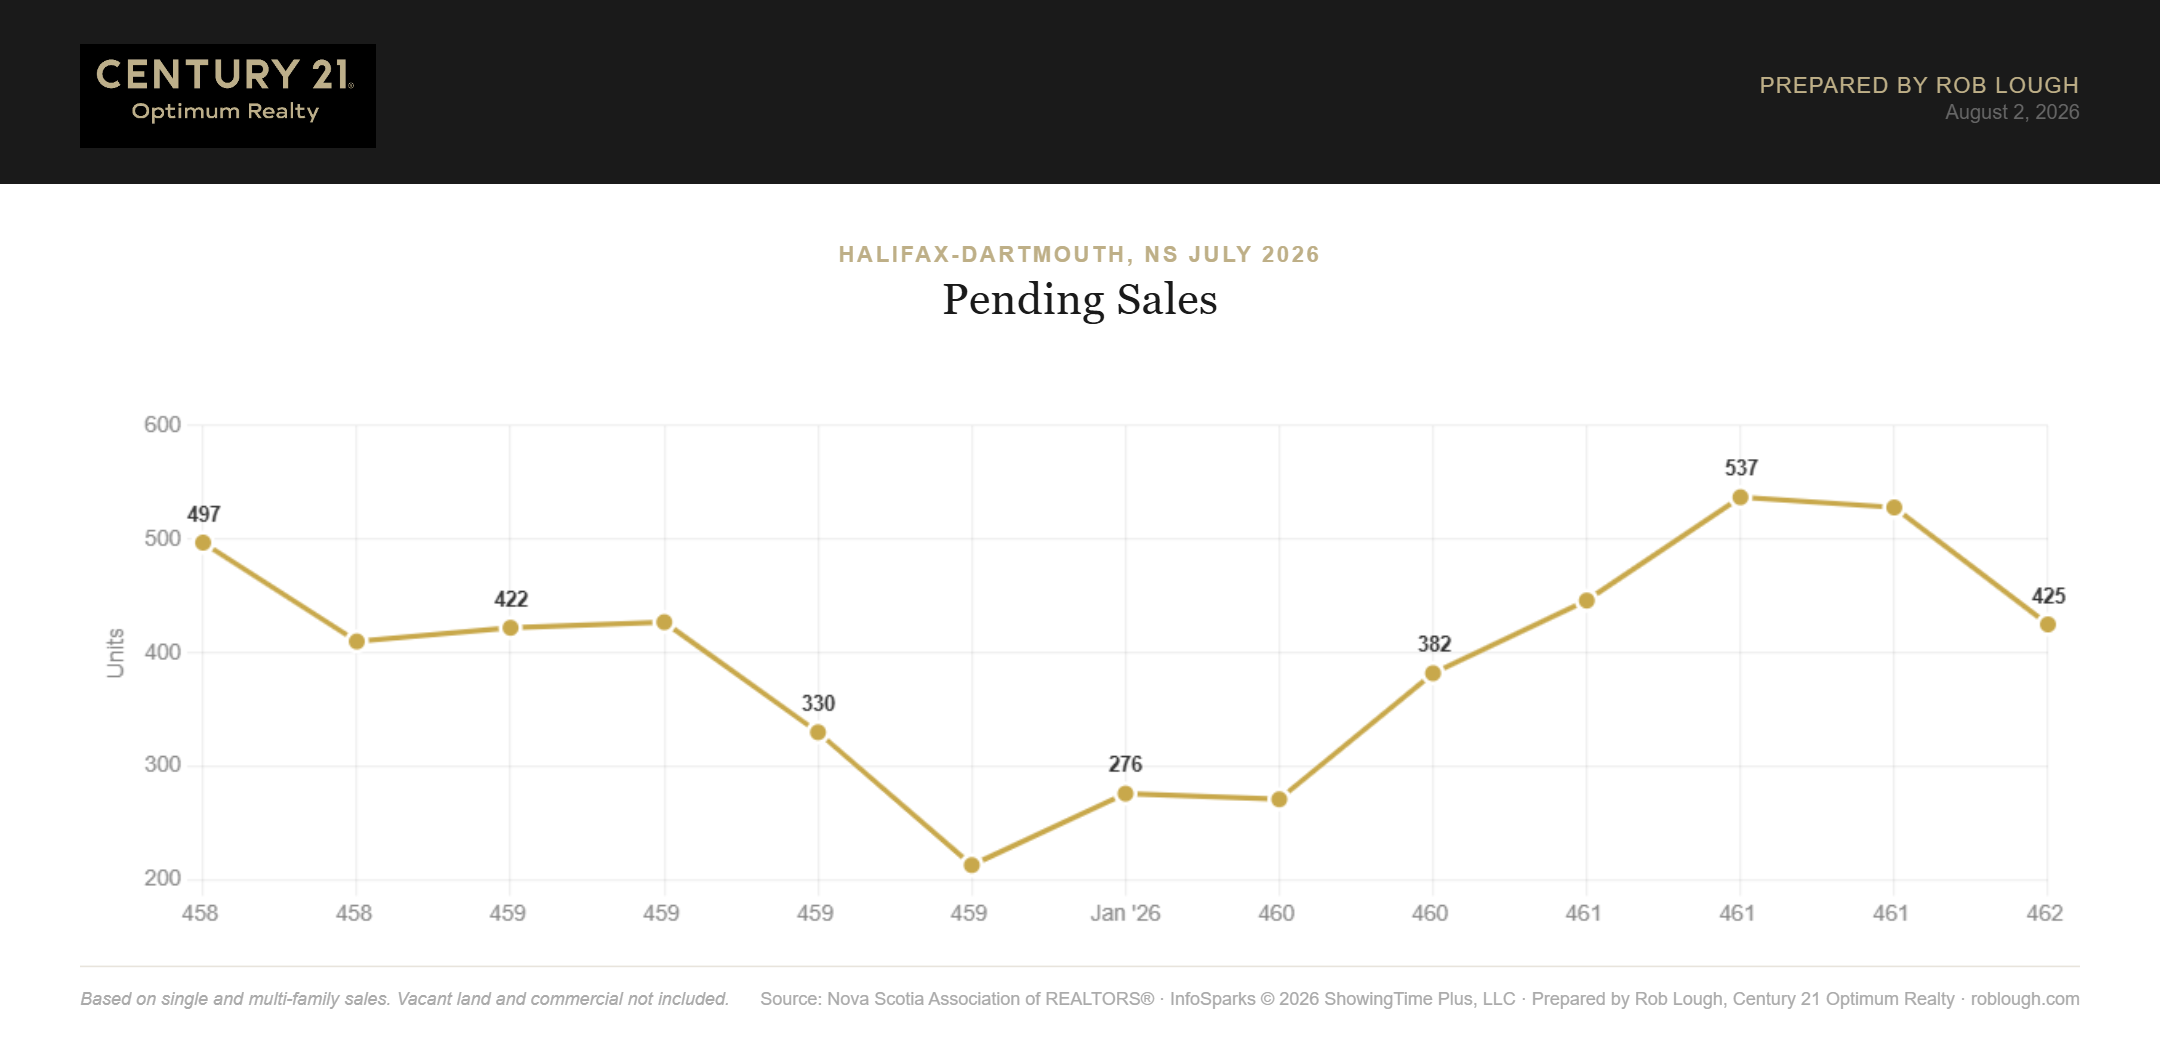
Halifax-Dartmouth Real Estate Market Stats July 2026 Number of pending sales
Dollar Volume of Closed Sales
Closed dollar volume was $278.7 million in July, down 15.7% from June’s $330.5M and 6.6% below July 2025’s $298.3M. Fewer transactions at slightly softer prices compounded into the largest month-over-month volume drop since the winter.
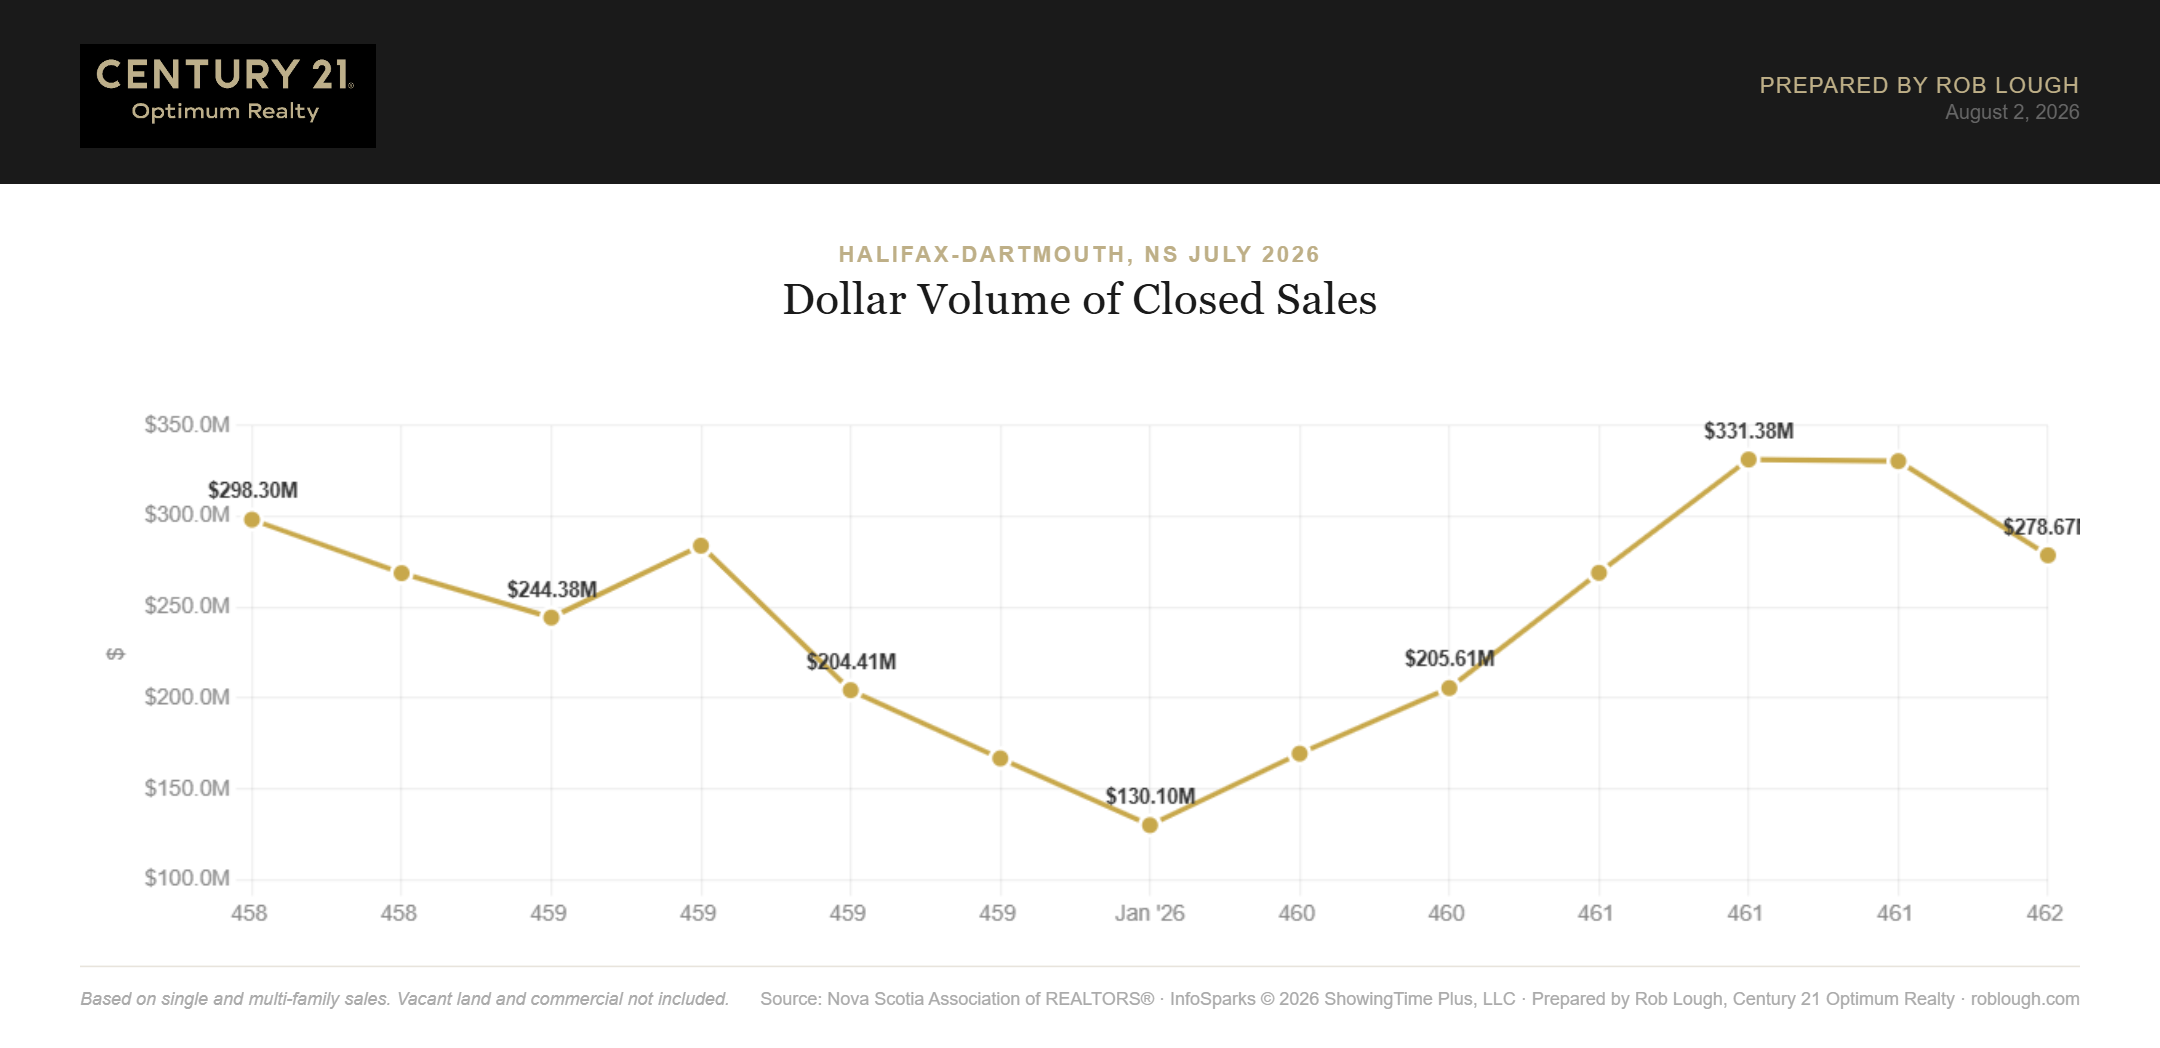
Halifax-Dartmouth Real Estate Market Stats July 2026 Dollar Volume of Closed Sales
Average Sales Price
The average sales price was $599,299 in July, down 3.0% from June’s $617,691 but up 0.9% from July 2025’s $594,223. This is the first month since January that the average has dipped below $600,000.
The year-over-year comparison is the one worth holding onto: despite a 25% increase in available inventory, average prices are still marginally higher than they were twelve months ago. Supply has grown far faster than prices have given way.
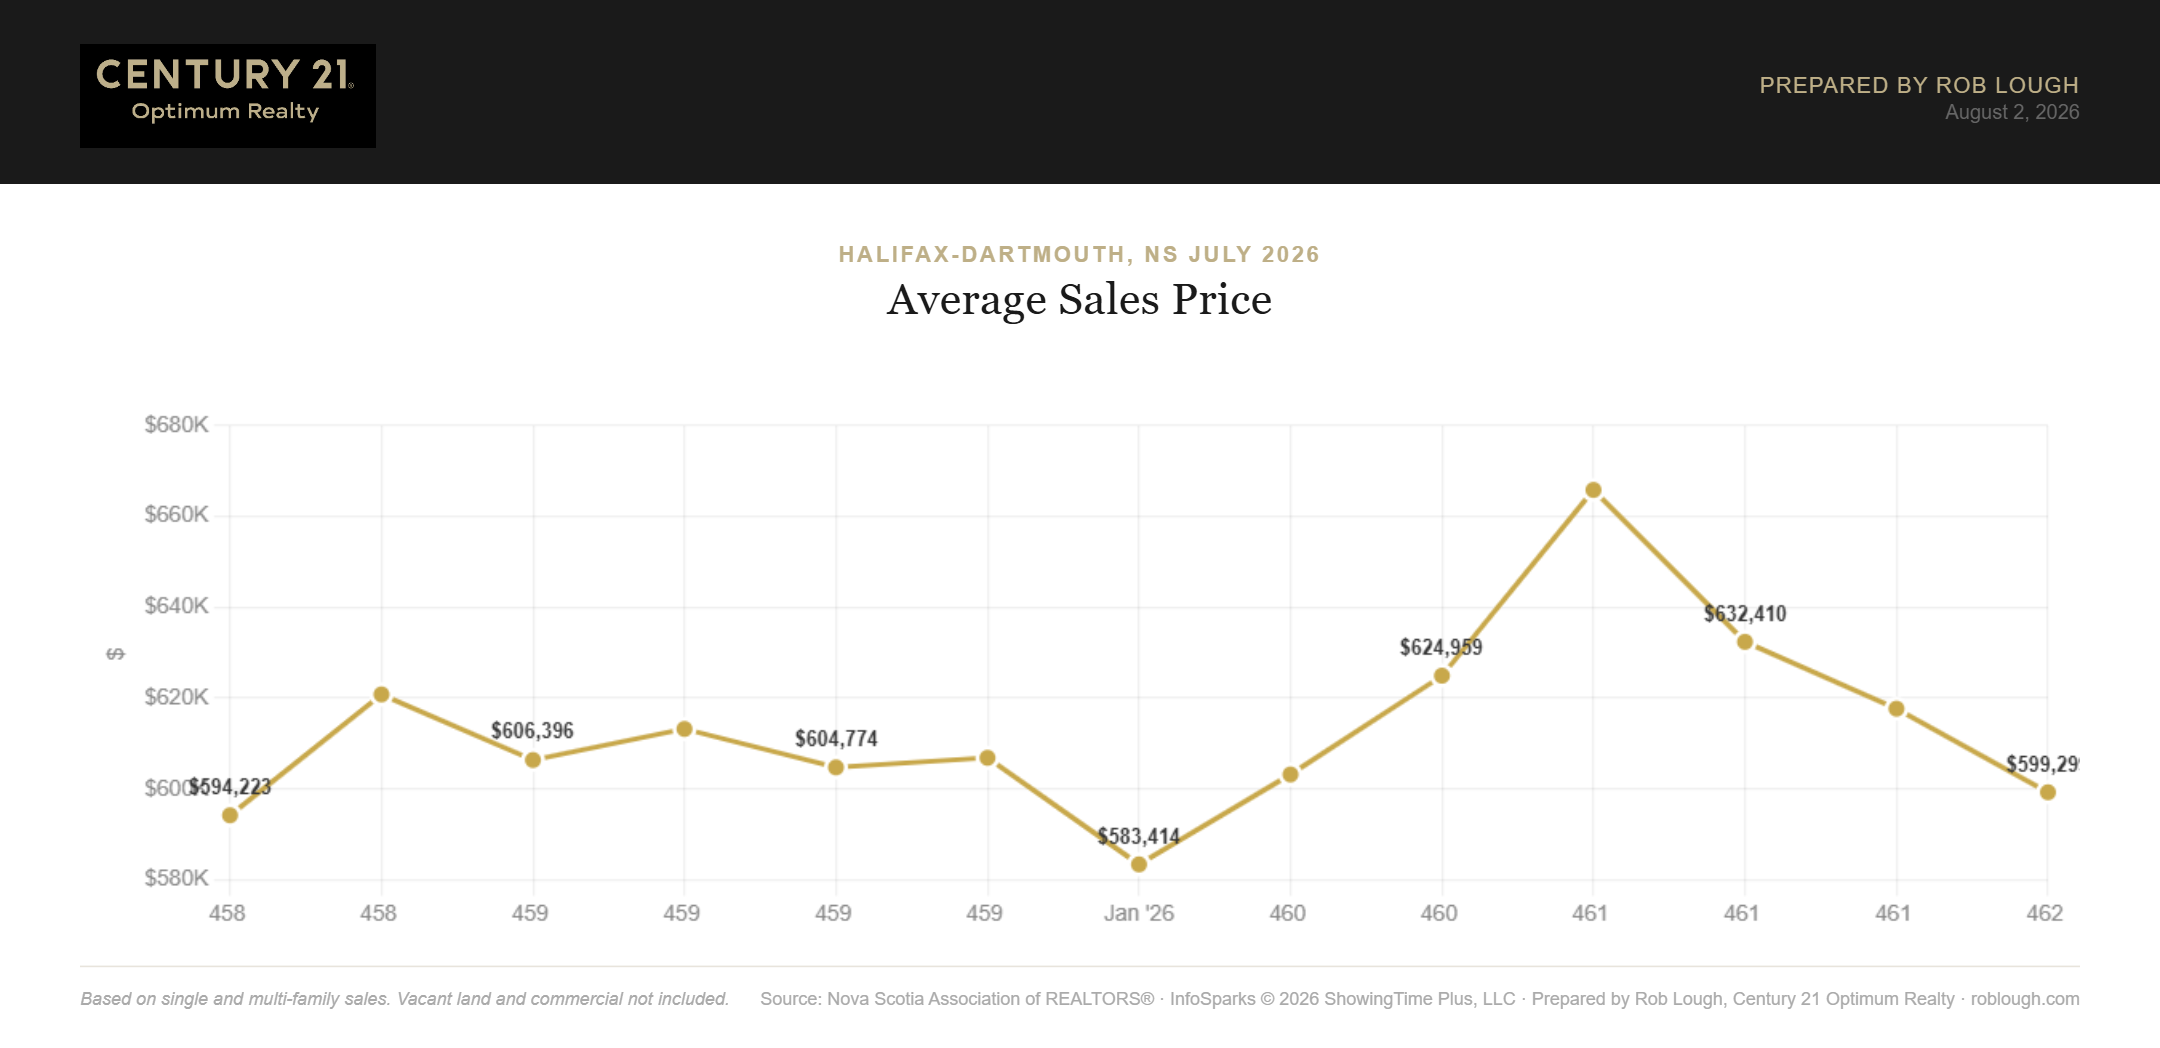
Halifax-Dartmouth Real Estate Market Stats July 2026 Average Sales Price
Median Sales Price
The median sales price was $550,000 in July 2026, down from June’s $568,865 and 0.9% below July 2025’s $555,000. Median and average moved in the same direction this month, which suggests the softening is broad rather than a quirk of what happened to sell.
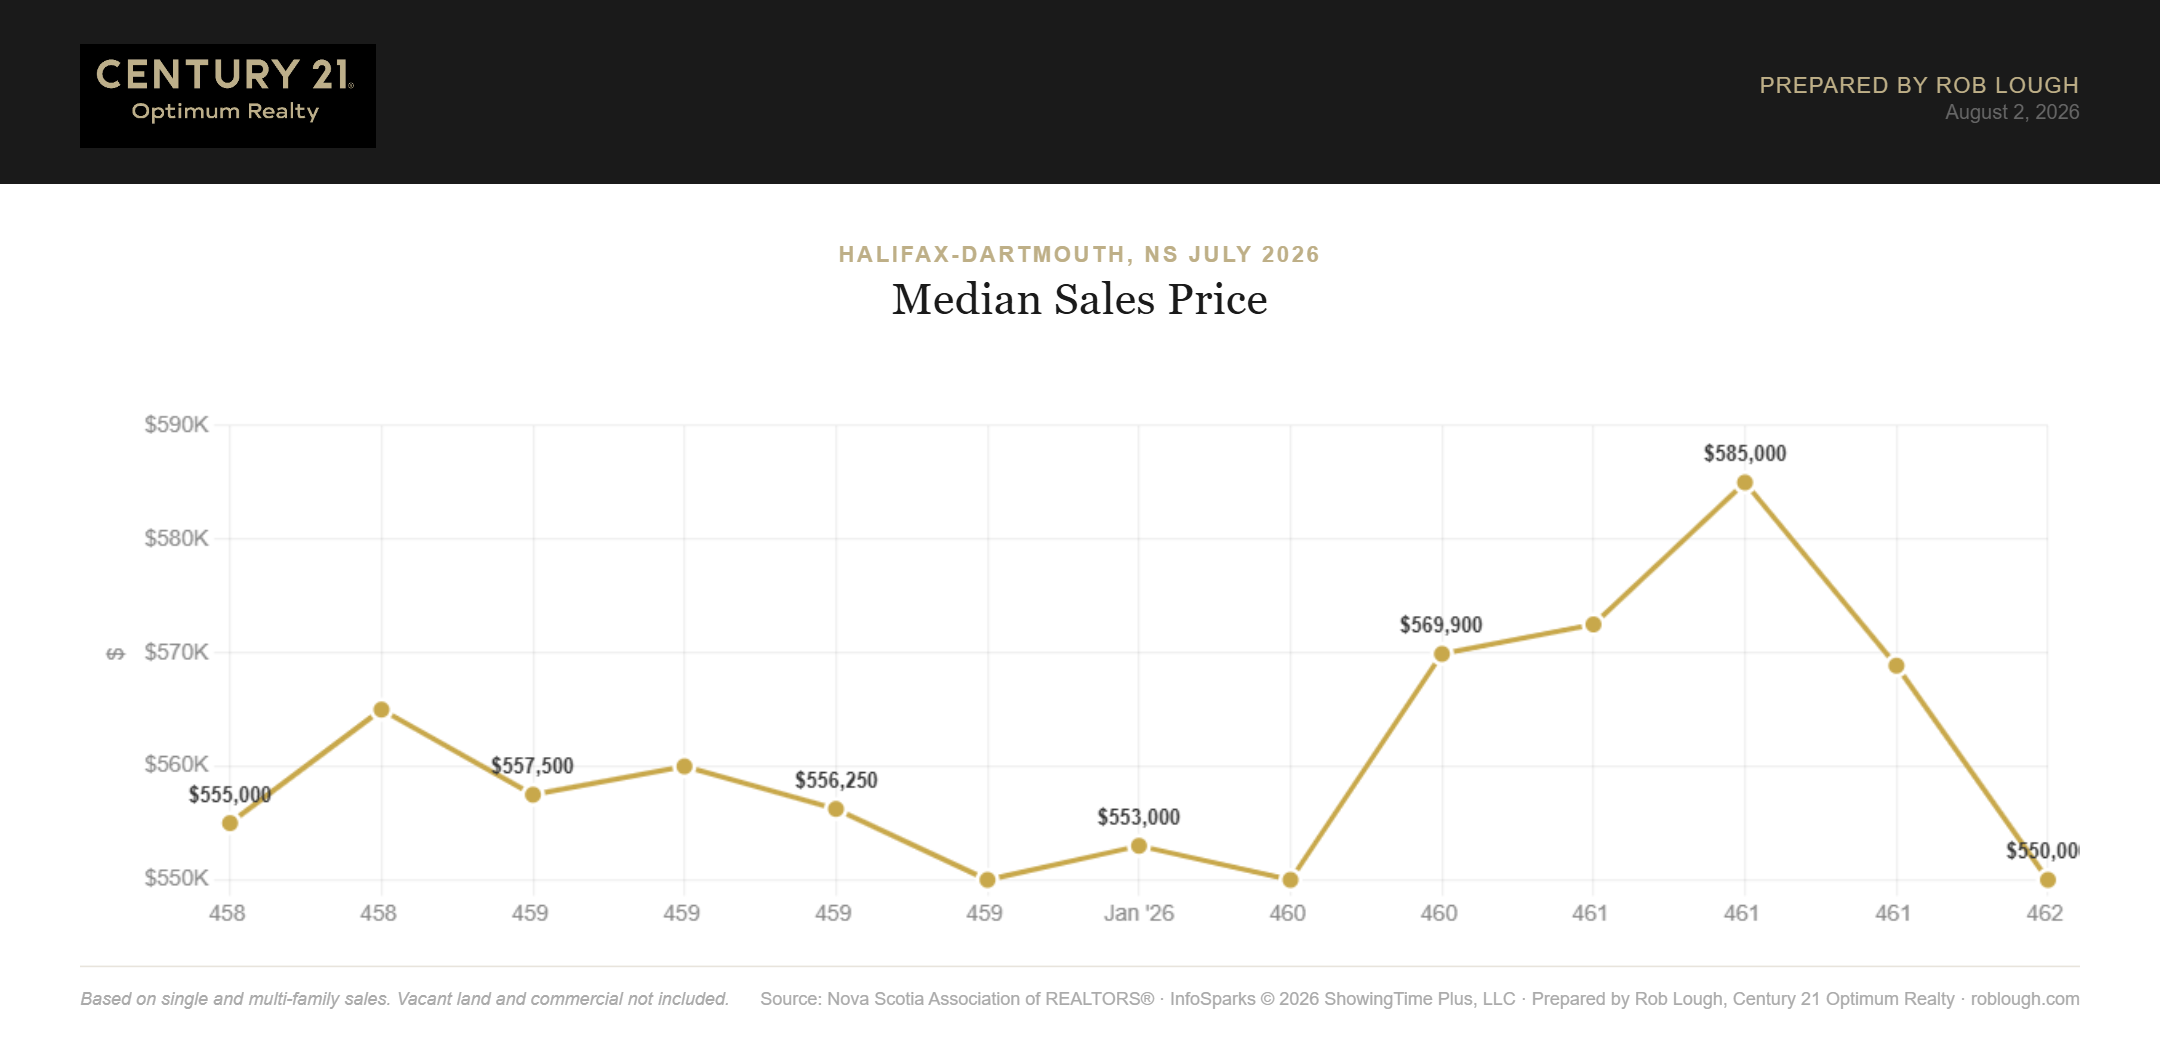
Halifax-Dartmouth Real Estate Market Stats July 2026 Median Sales Price
For context on how Halifax pricing evolved through the spring, see Halifax-Dartmouth Real Estate Market Stats: June 2026.
Average Price Per Square Foot
Here’s where the “prices are falling” narrative gets complicated. Average price per square foot on total living area was $329 in July, up from June’s $322 and up 2.2% from $322 a year ago. On main living area, it came in at $433, down from June’s $438 but still 0.7% above July 2025’s $430.
On a per-foot basis, Halifax-Dartmouth values are holding and on TLA, actually rising. The softer headline prices reflect a shift toward smaller and lower-priced homes selling this month, not a decline in what property is worth.
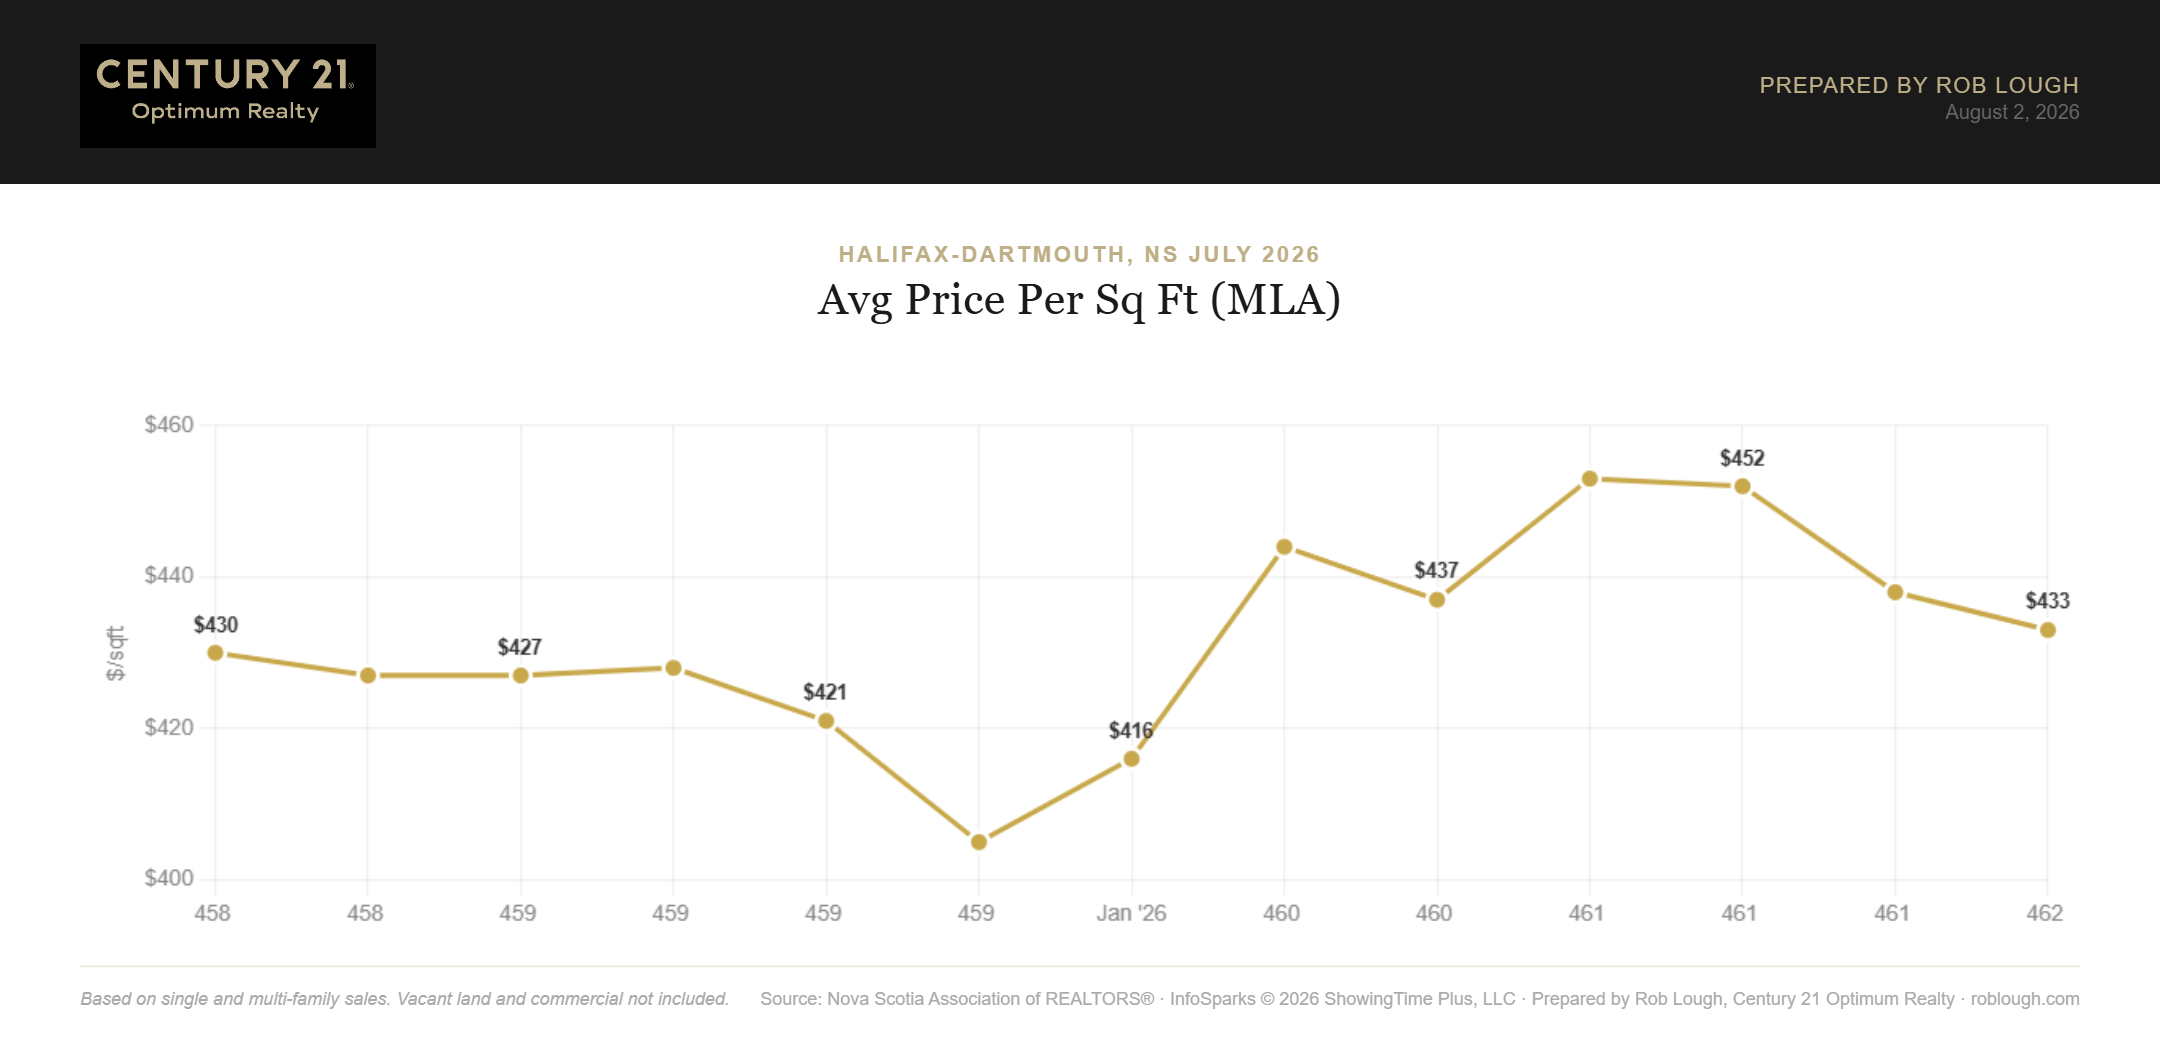
Halifax-Dartmouth Real Estate Market Stats July 2026 Average Price per Sq ft MLA
New Listings
673 new listings came to market in July, down 10.4% from June’s 751 but 5.2% above July 2025’s 640. The spring surge, April and May both cleared 800, has settled into a normal summer pace, though sellers are still listing more actively than they were a year ago.
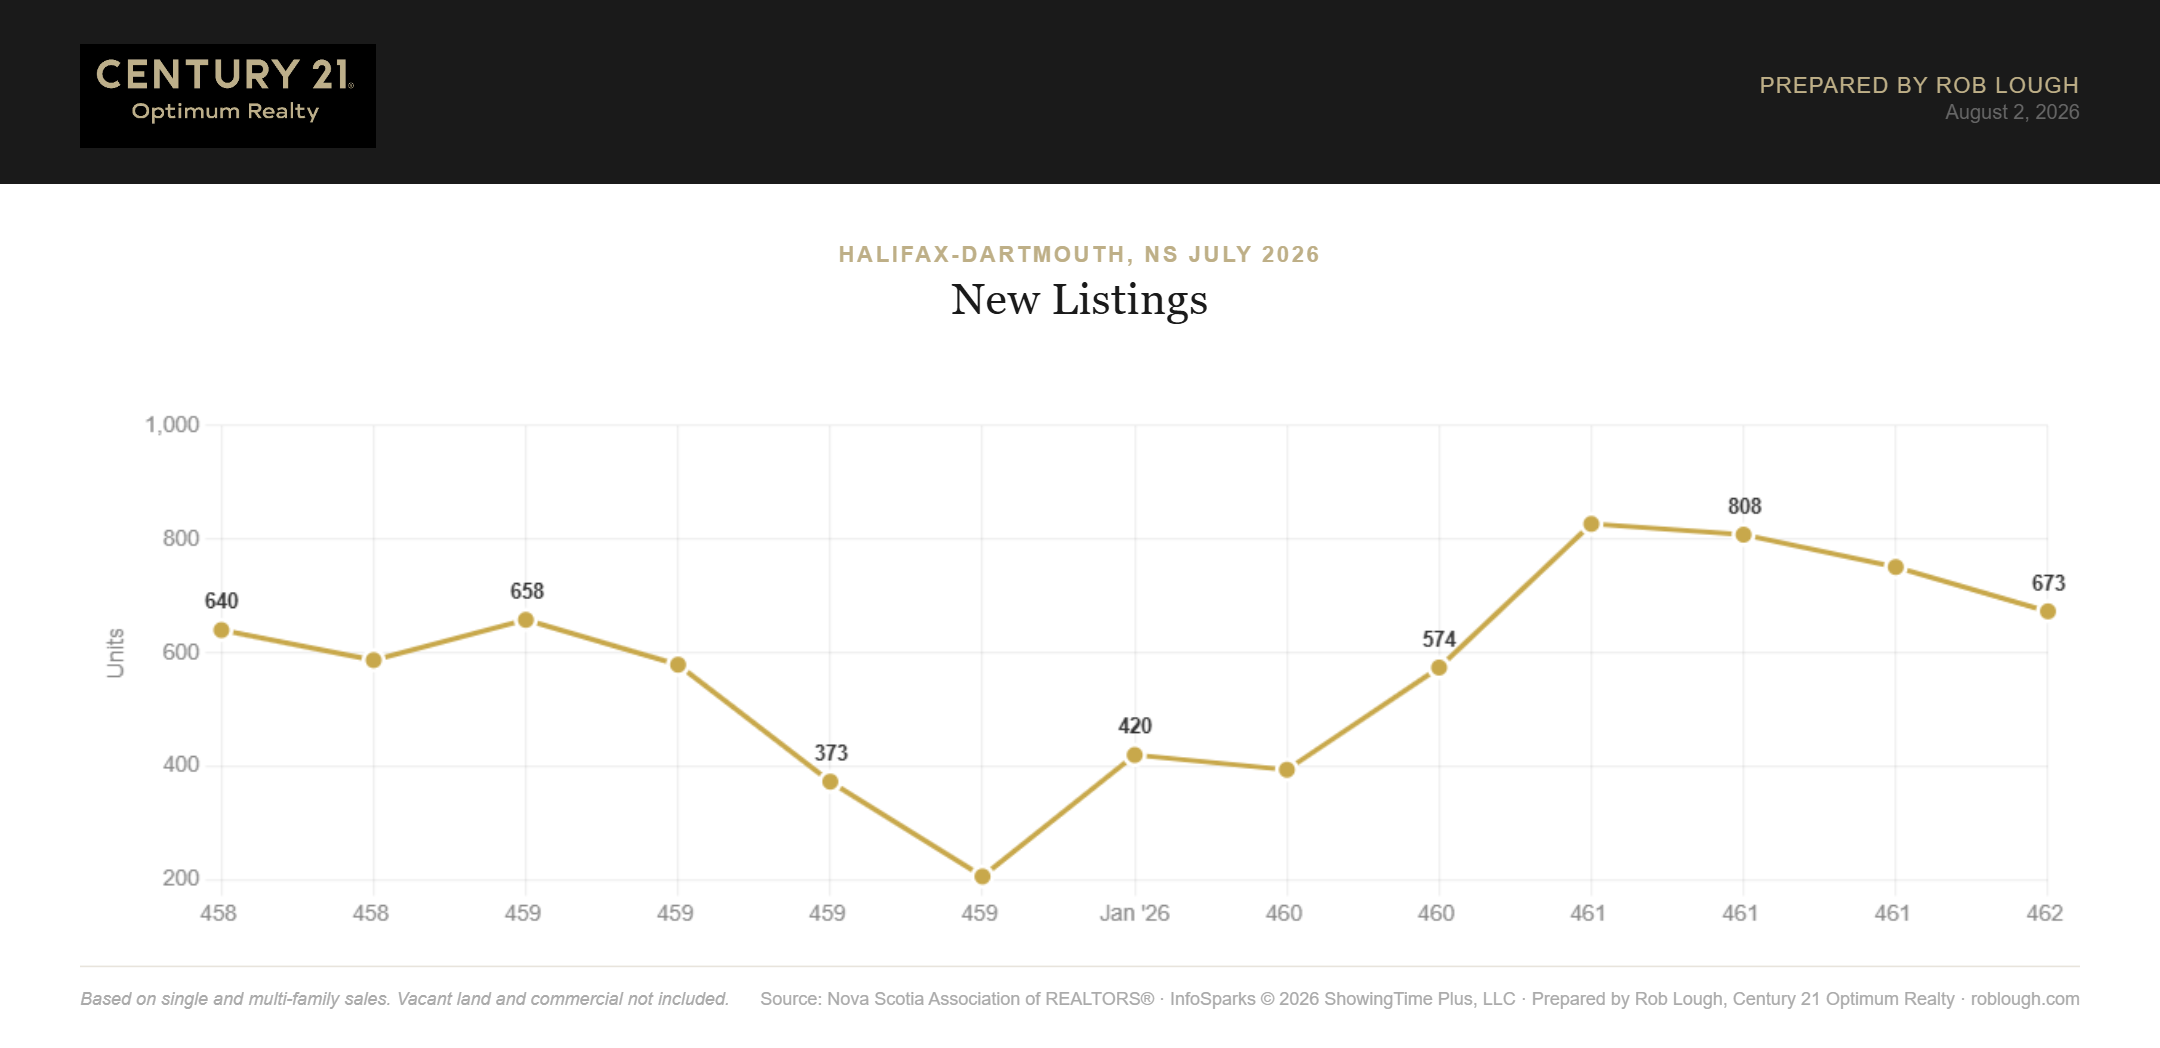
Halifax-Dartmouth Real Estate Market Stats July 2026 Number of new listings
Homes for Sale (Active Inventory)
Active inventory reached 1,504 homes for sale at the end of July, the highest level in the trailing 13 months and up 3.4% from June. Compared to a year ago, inventory is up 25.3%, a quarter more homes on the market than last July.
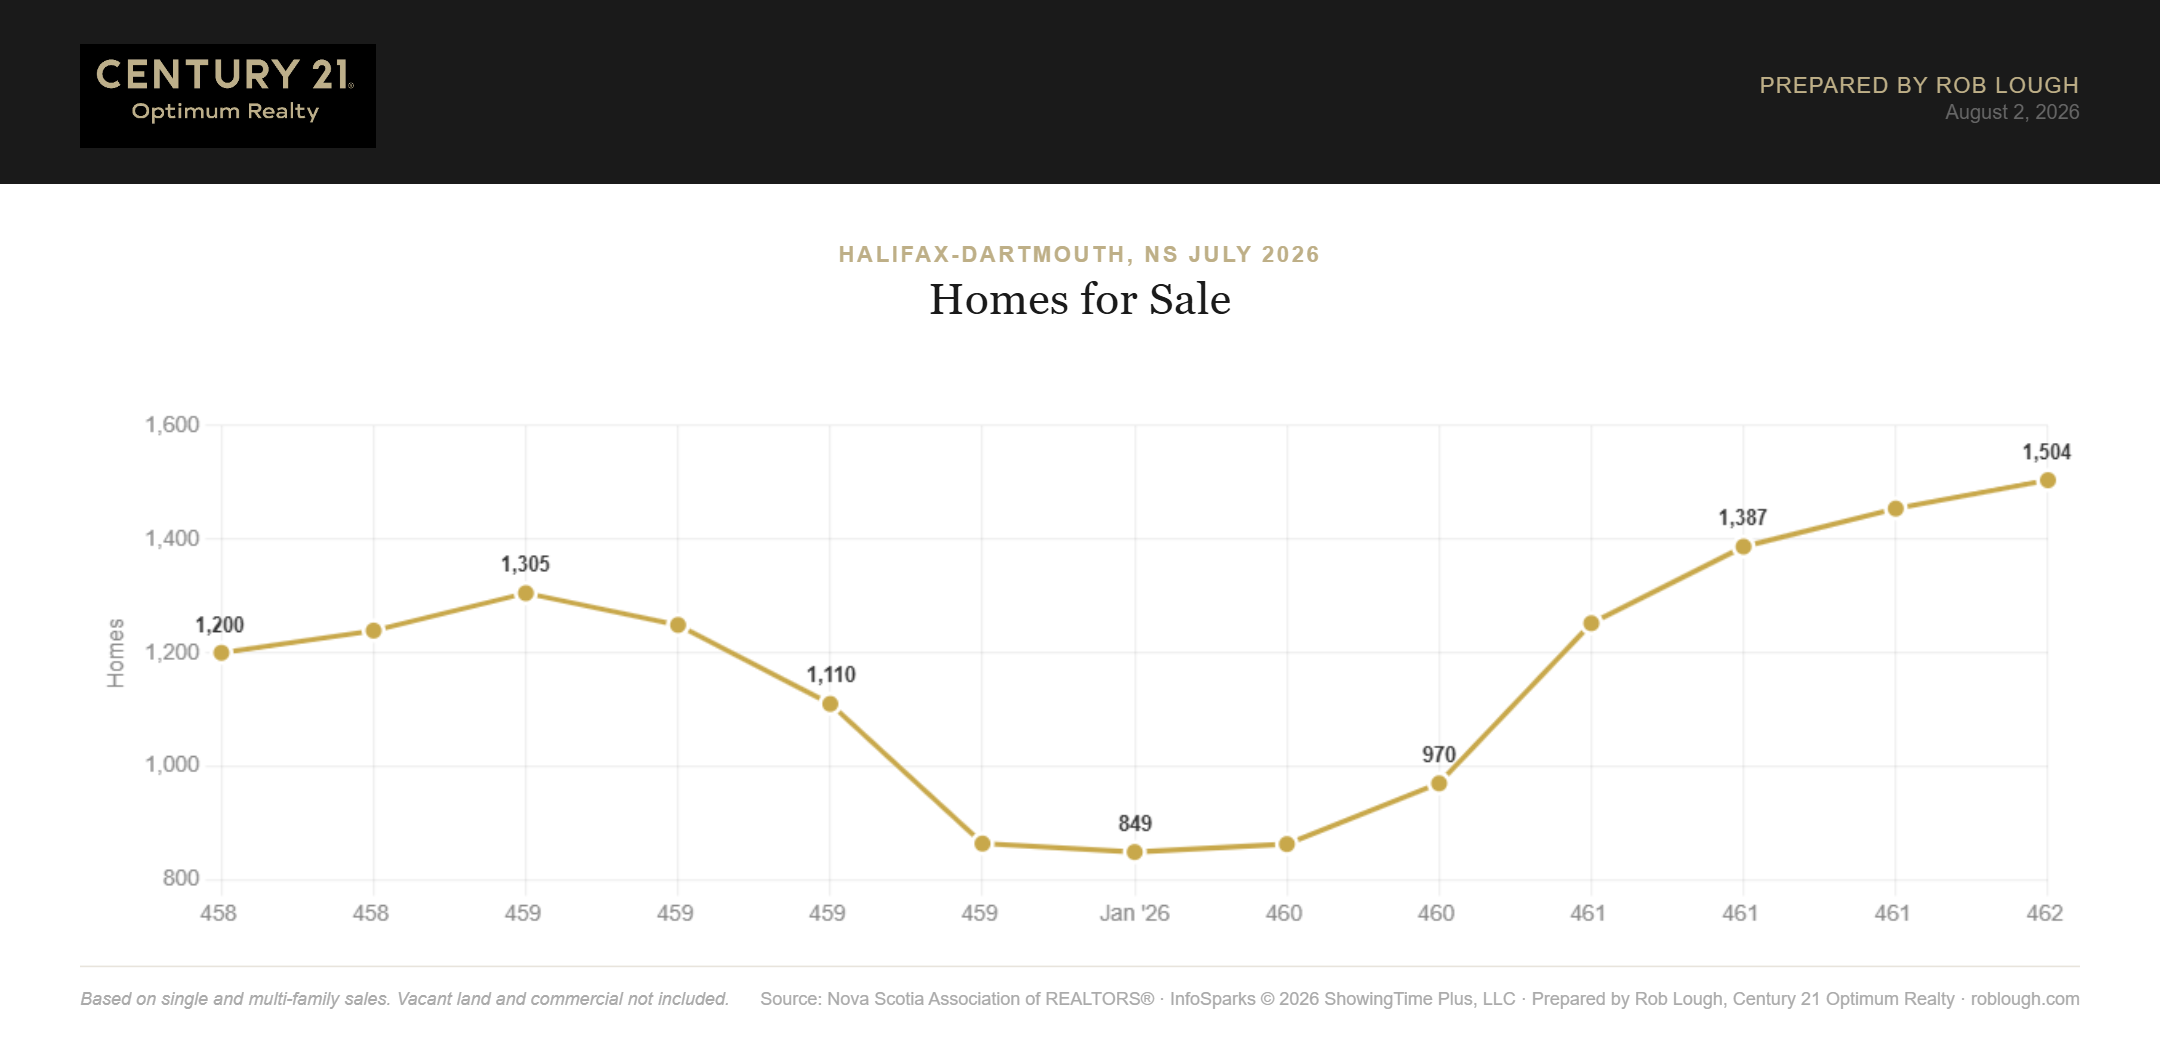
Halifax-Dartmouth Real Estate Market Stats July 2026 Number of homes for sale
Note what’s driving this: new listings were actually down 10.4% from June. Inventory is building because homes are selling more slowly, not because sellers are flooding the market. Browse the Halifax-Dartmouth Real Estate Dashboard to see what’s currently available.
Months Supply of Homes for Sale
Months supply came in at 3.9, up from 3.7 in June and up sharply from 2.9 a year ago, another 13-month high. A balanced market is typically 4 to 6 months of supply, which means Halifax-Dartmouth is now essentially at the edge of balanced territory for the first time in this cycle.
For perspective: months supply sat at 2.1 in January and February. It has nearly doubled in six months.
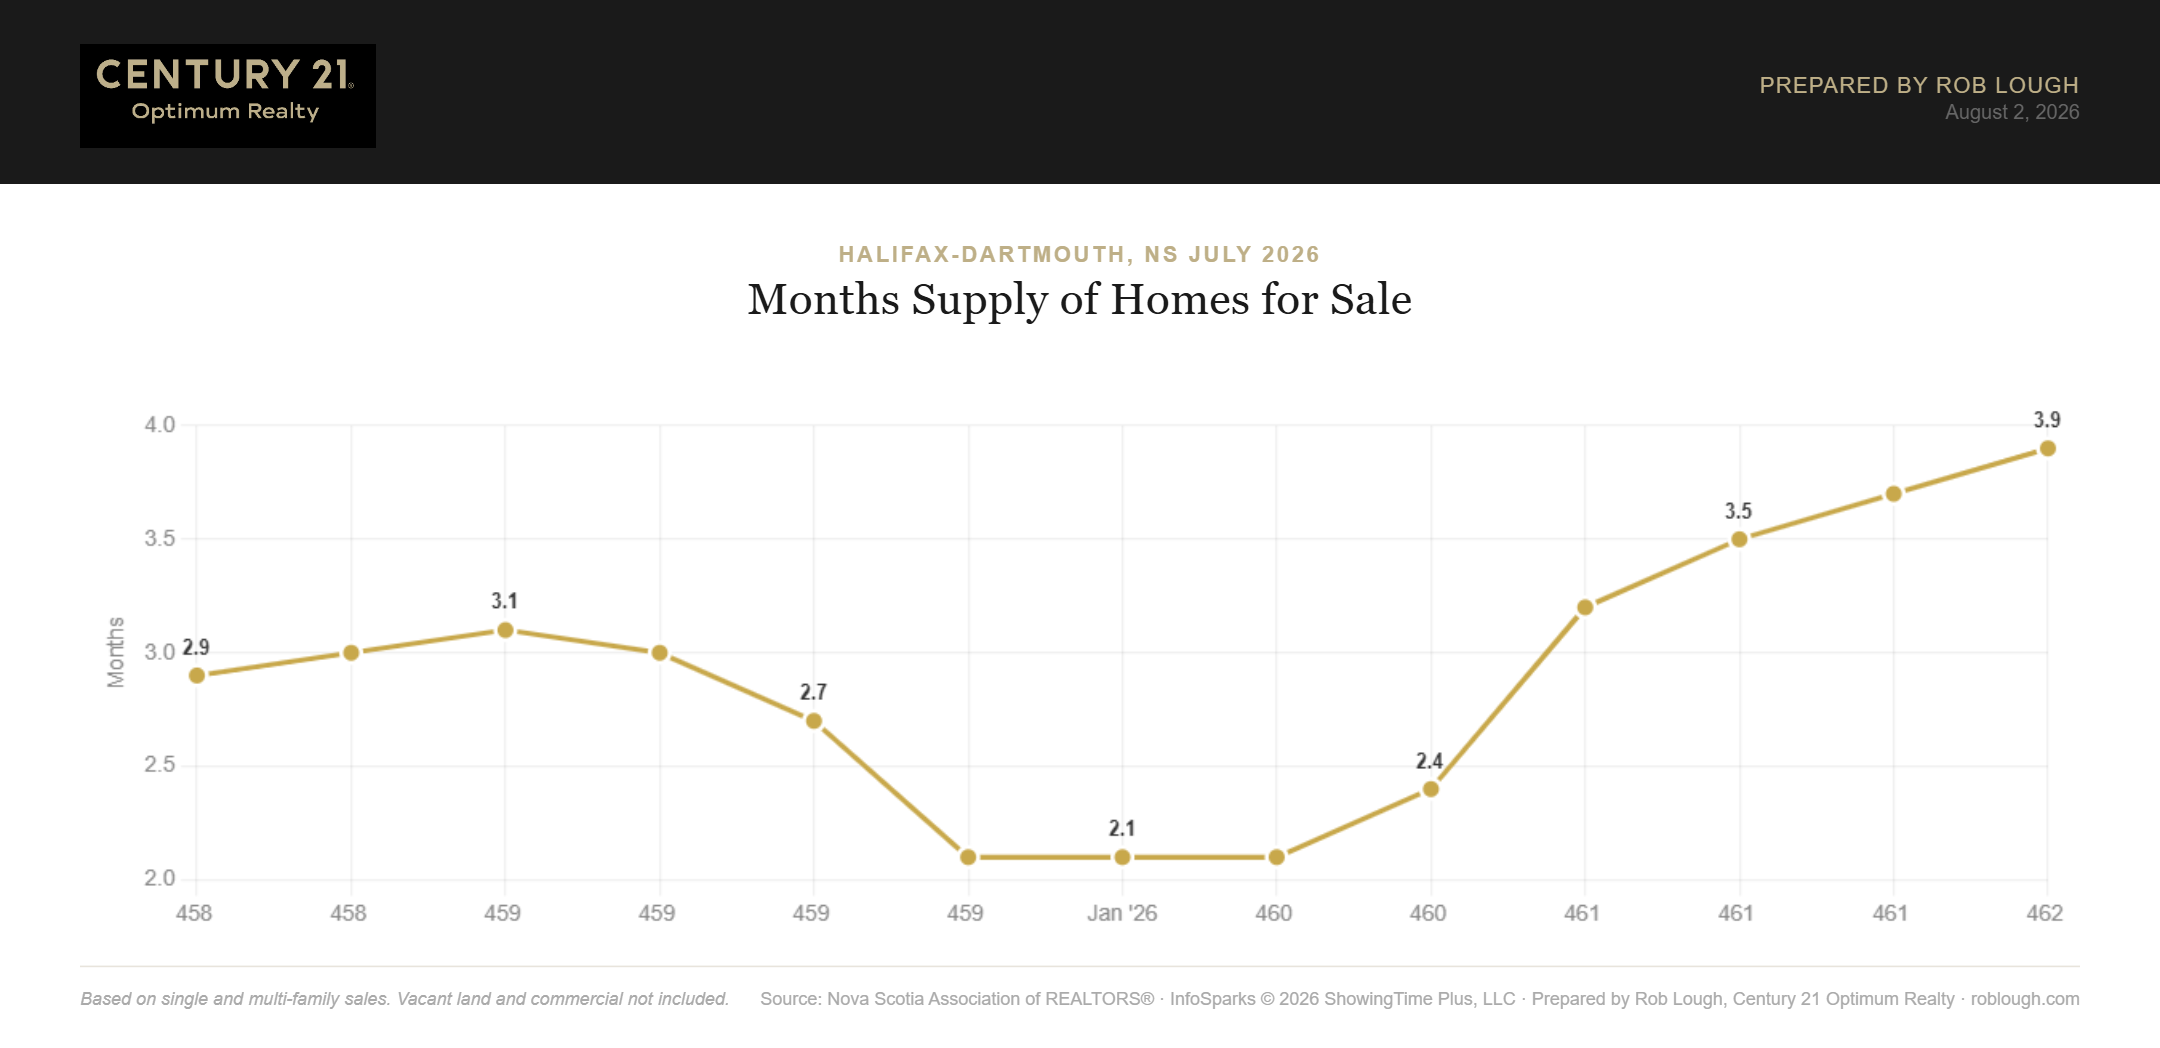
Halifax-Dartmouth Real Estate Market Stats July 2026 Months supply of Inventory
Average Days on Market
Average days on market was 36 in July, up from 32 in June and above last July’s 29-day pace. Homes are taking about a week longer to sell than they did a year ago, still fast by historical standards, and well off January’s 55-day peak, but the trend is unmistakable.
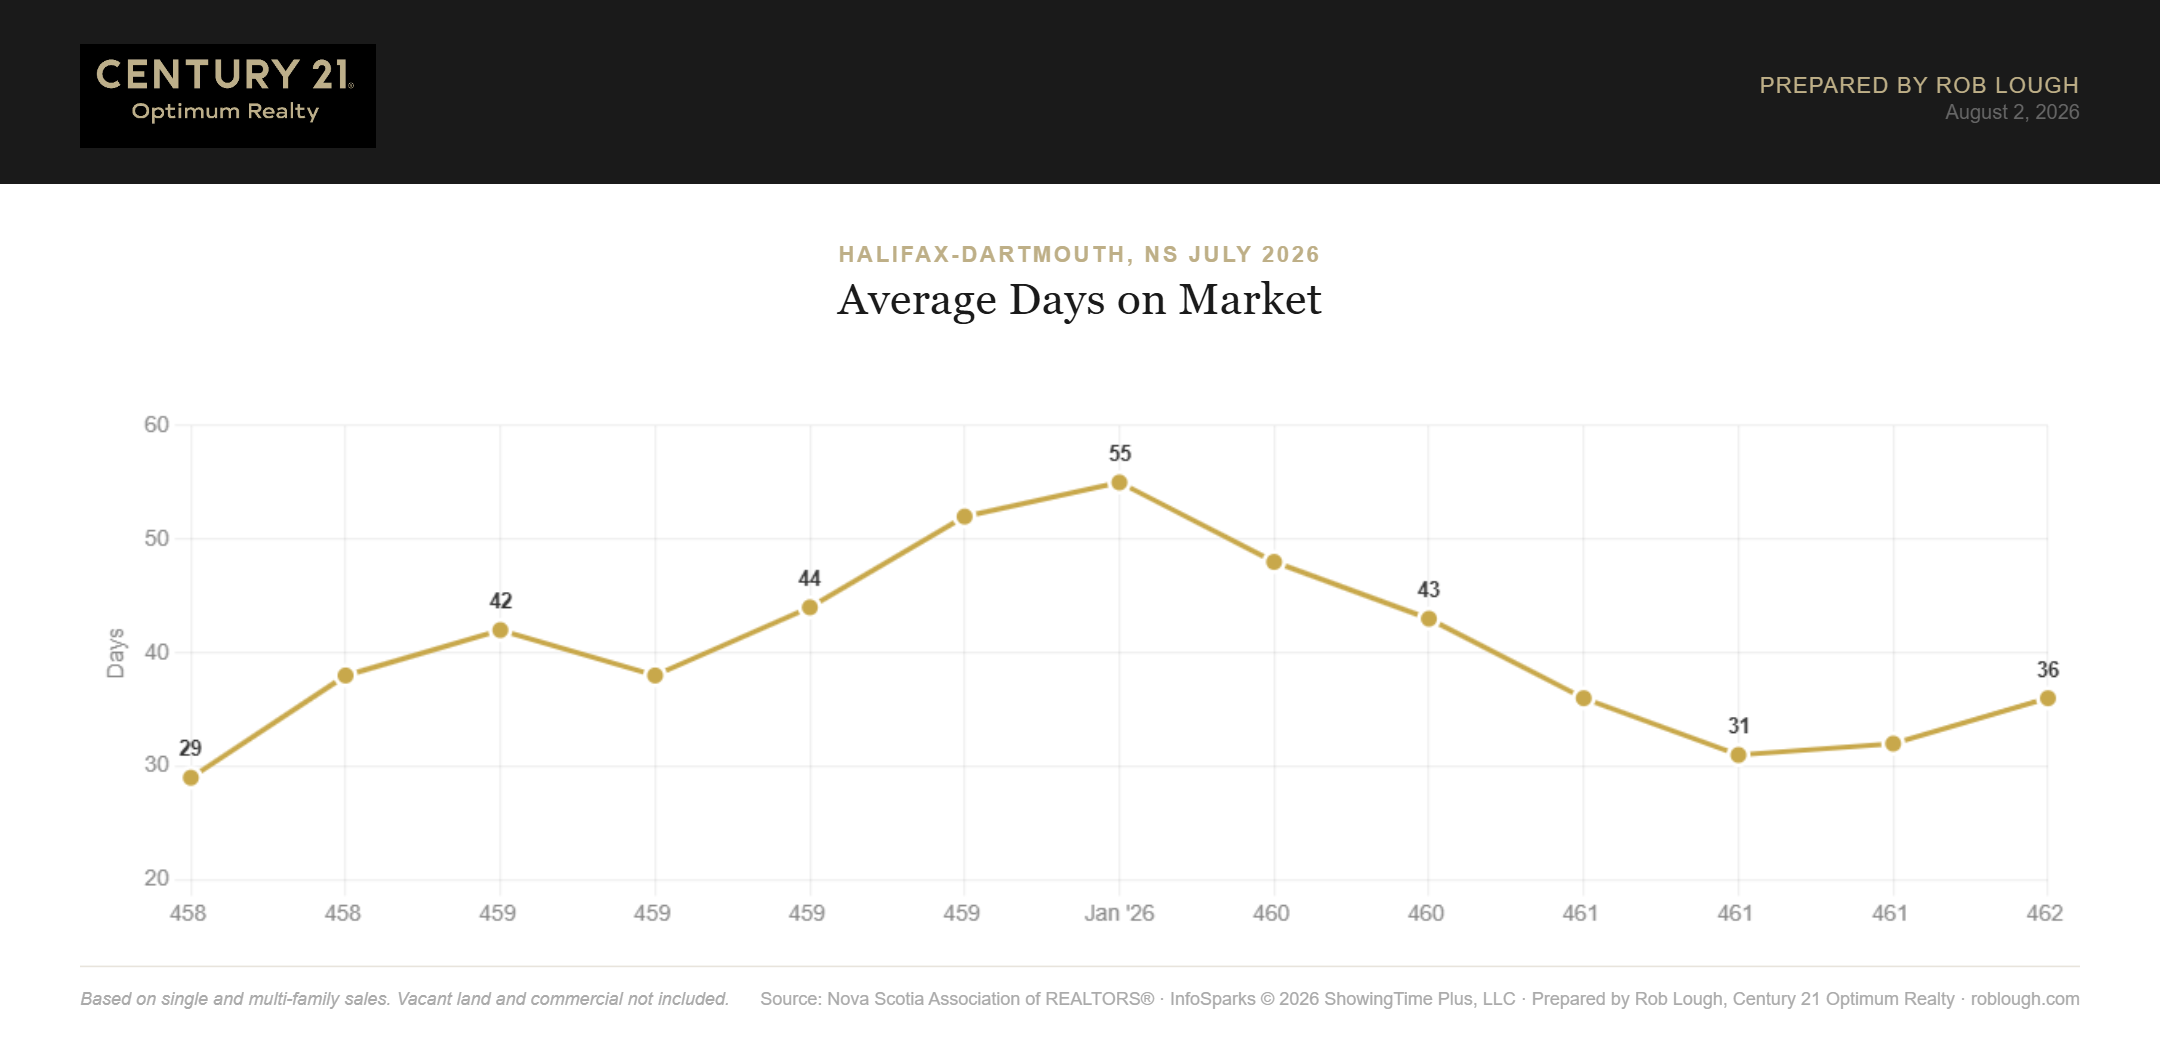
Halifax-Dartmouth Real Estate Market Stats July 2026 Average Days on Market
If you’re weighing whether to move now or wait, a free home valuation is a good first step to understanding where your property sits in today’s market rather than last spring’s.
Sale-to-Last-List Price Ratio
Average percent of last list price was 98.5% in July, unchanged from June but down from 99.6% a year ago. Homes are still selling within striking distance of asking, but the era of consistent overbidding is behind us for now.
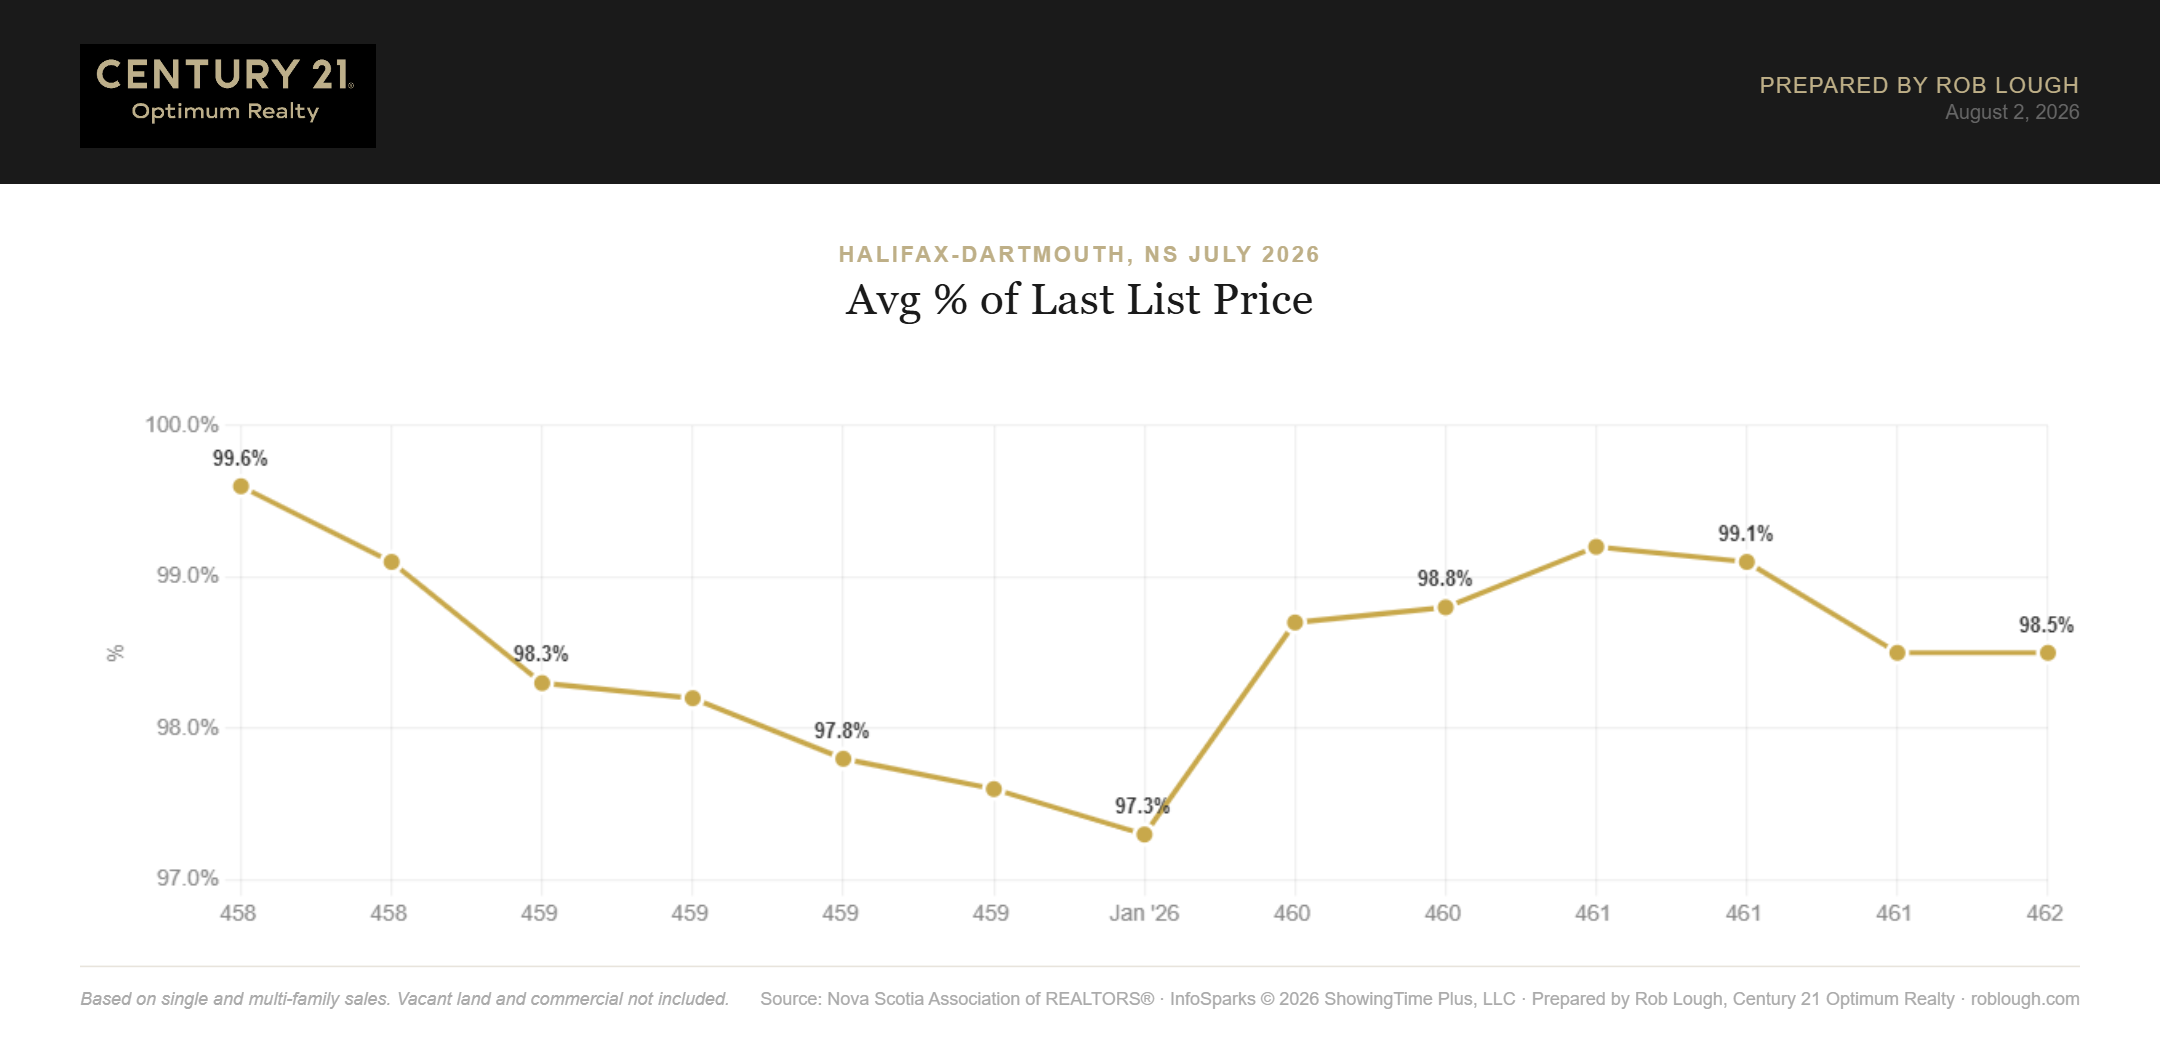
Halifax-Dartmouth Real Estate Market Stats July 2026 average % of last list price
Sale-to-Original-List Price Ratio
The sale-to-original-list-price ratio was 96.9% in July, essentially flat with June’s 96.8% but well below last July’s 98.3%. The 1.6-point spread between the two ratios means the typical sold home saw a price reduction somewhere between first listing and final sale.
That gap is the single most useful number in this report for sellers. It’s the measurable cost of listing too high.
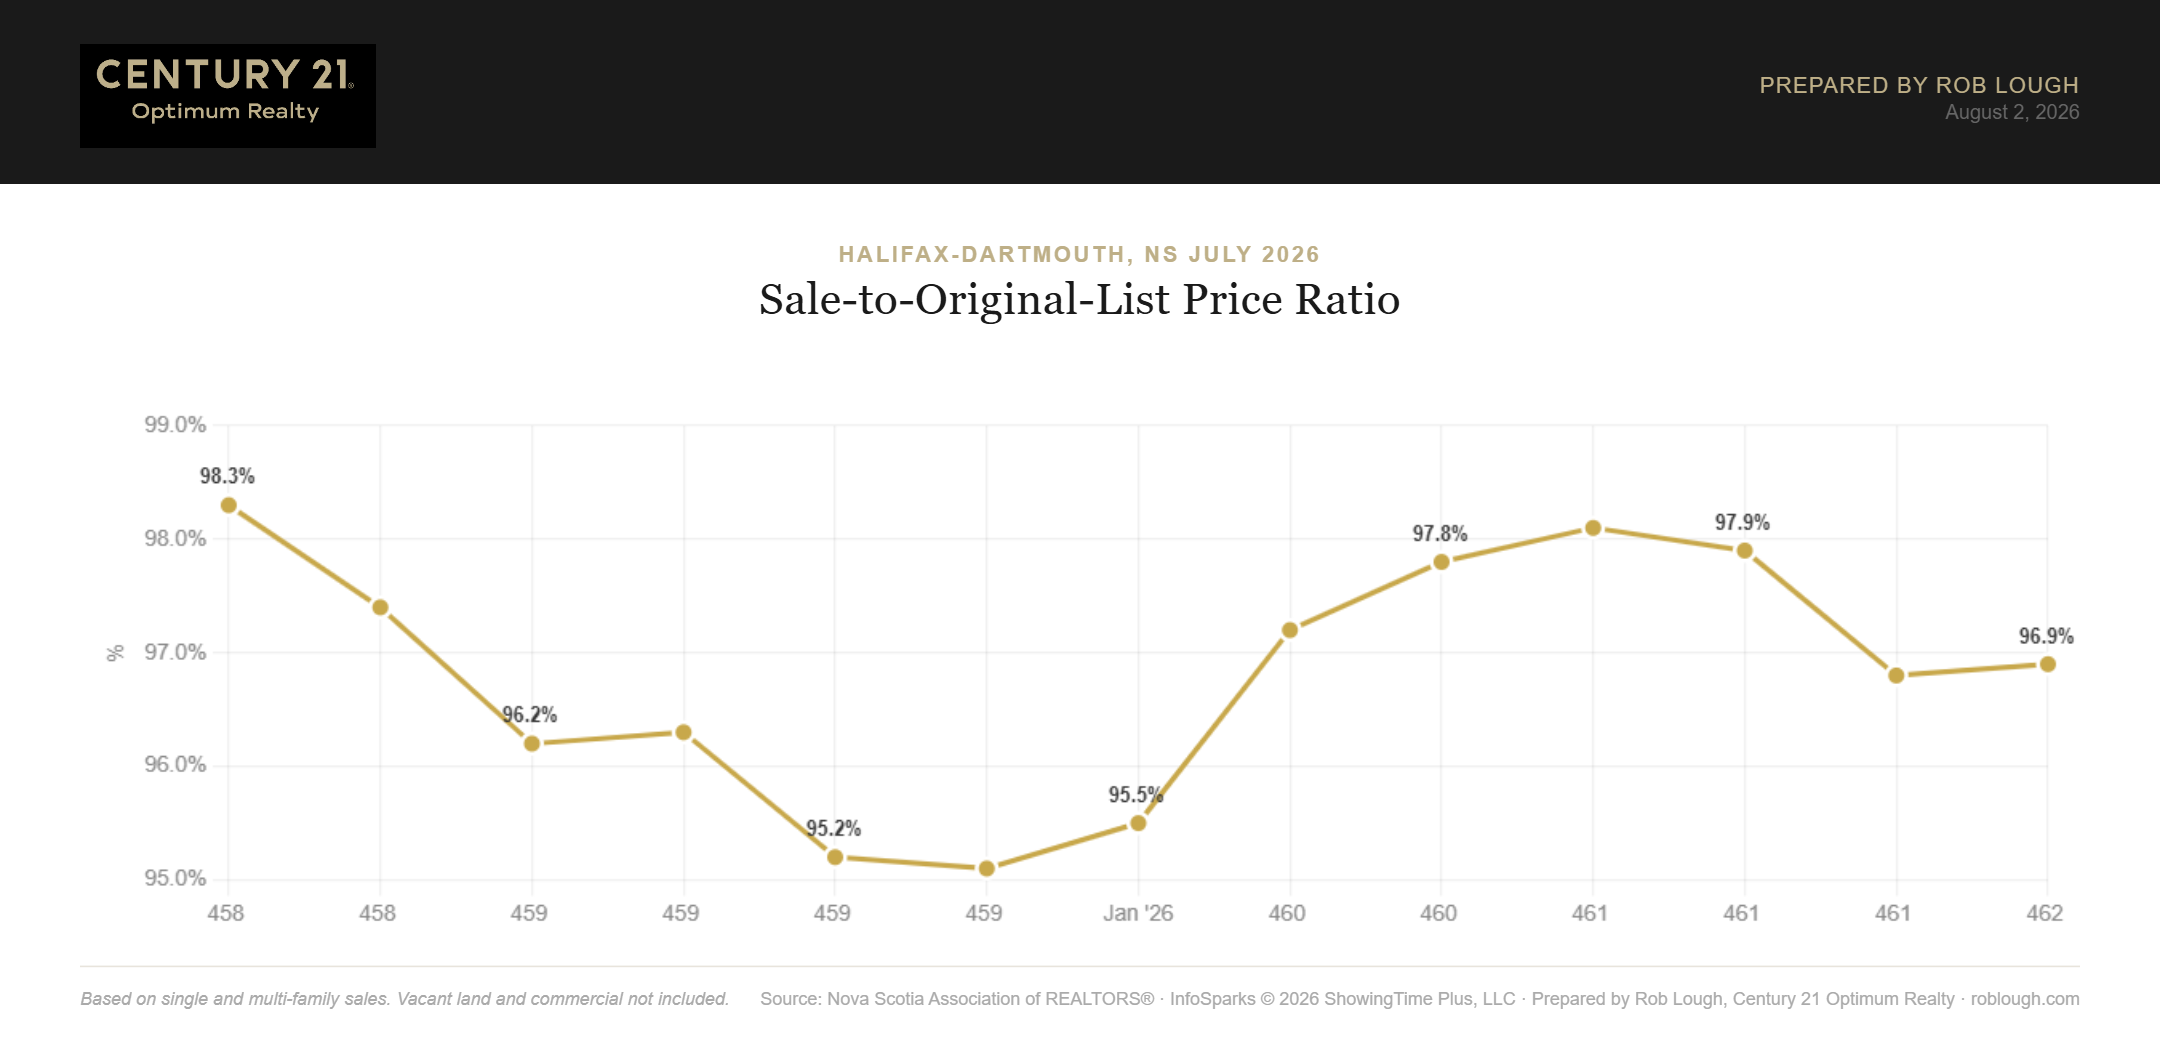
Halifax-Dartmouth Real Estate Market Stats July 2026 average % of original list price
For a practical framework on avoiding those adjustments altogether, see How to Price Your Home to Sell in Halifax.
Showings Per Listing
Average showings per listing was 4.5 in July, down from 4.6 in June and down from 5.2 a year ago. With 25% more listings competing for a similar pool of buyers, showing traffic per home is naturally thinner.
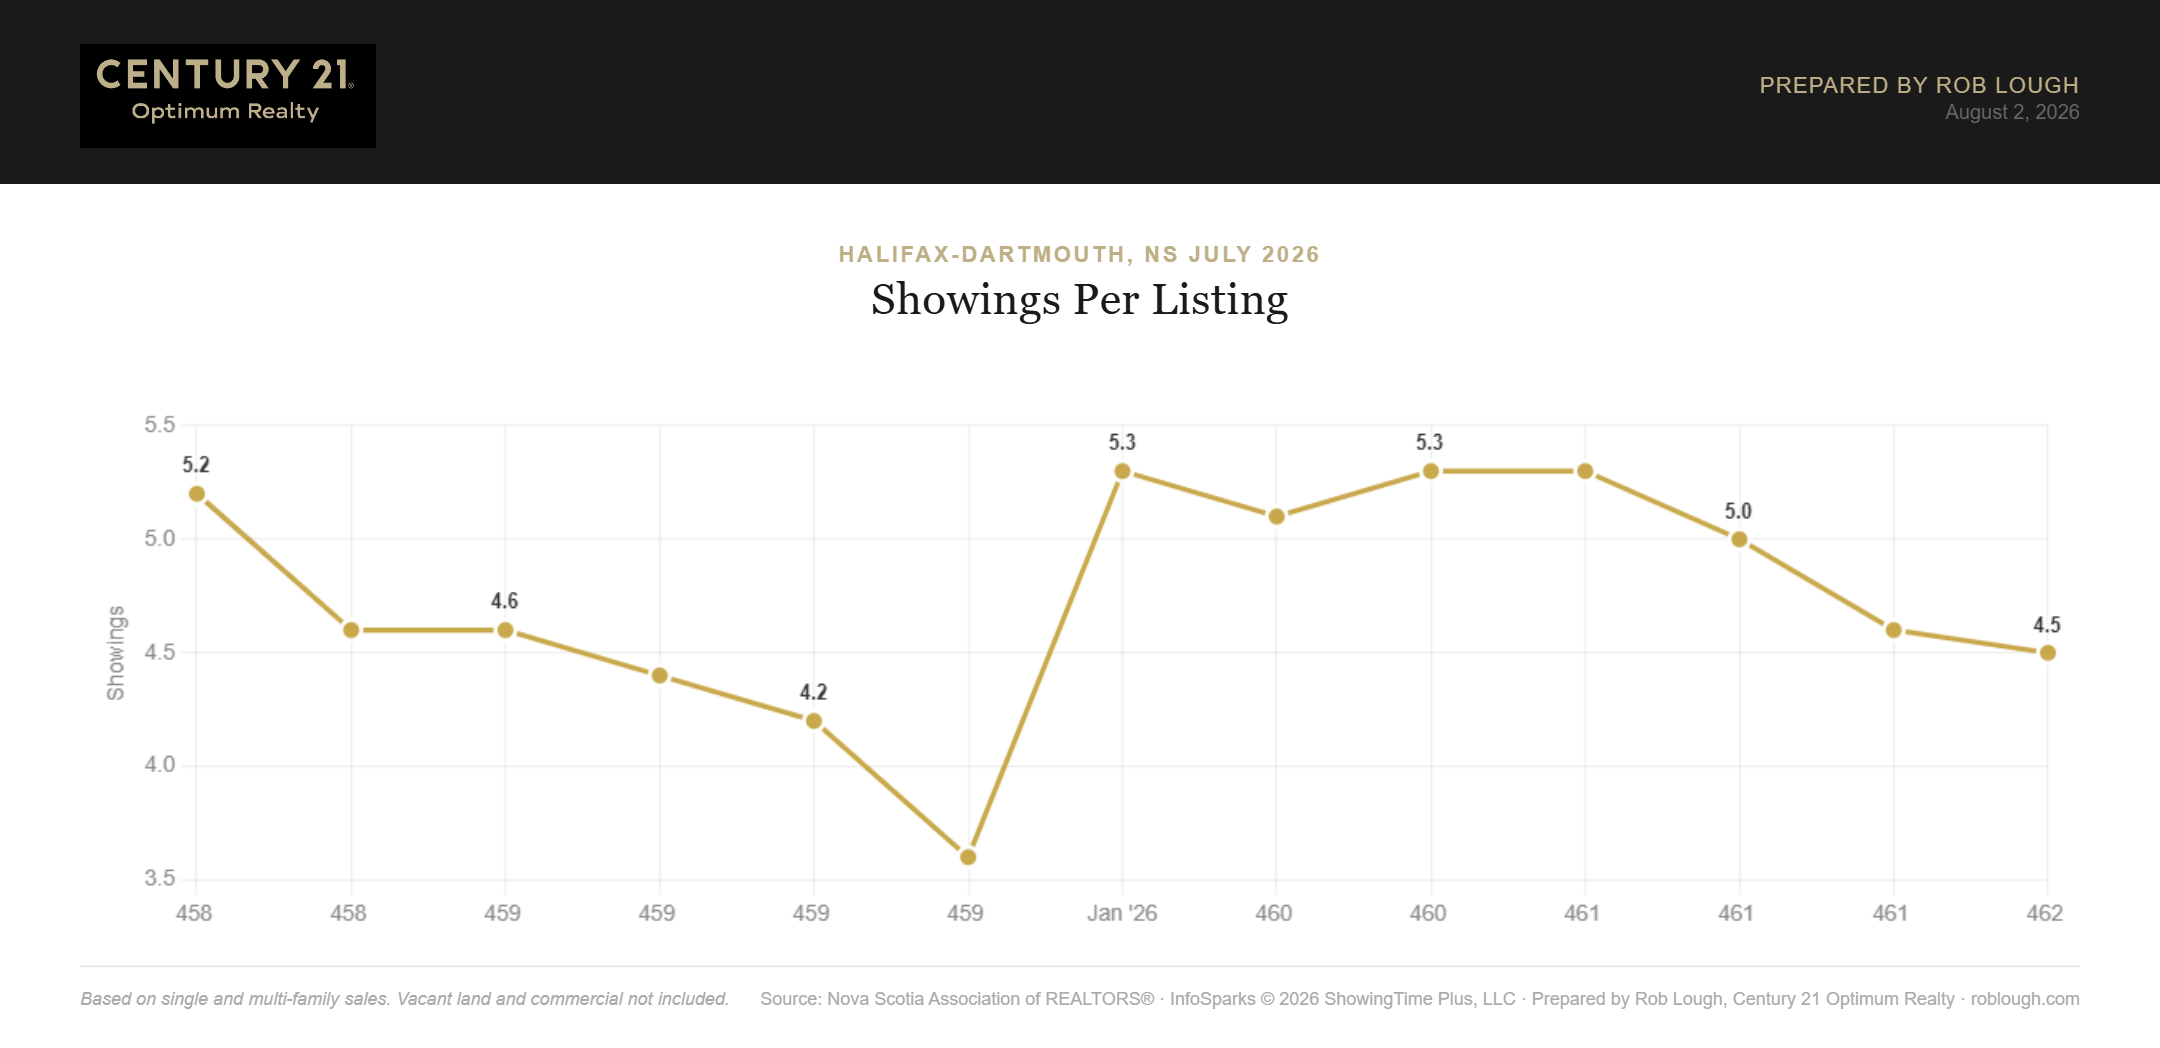
Halifax-Dartmouth Real Estate Market Stats July 2026 average number of showings per listing
Average showings to pending came in at 10.2, up from June’s 9.9 but still below last July’s 10.5. Buyers are taking marginally longer to commit than they were in the spring, though conversion remains more efficient than it was through the winter, when this figure climbed as high as 12.5.
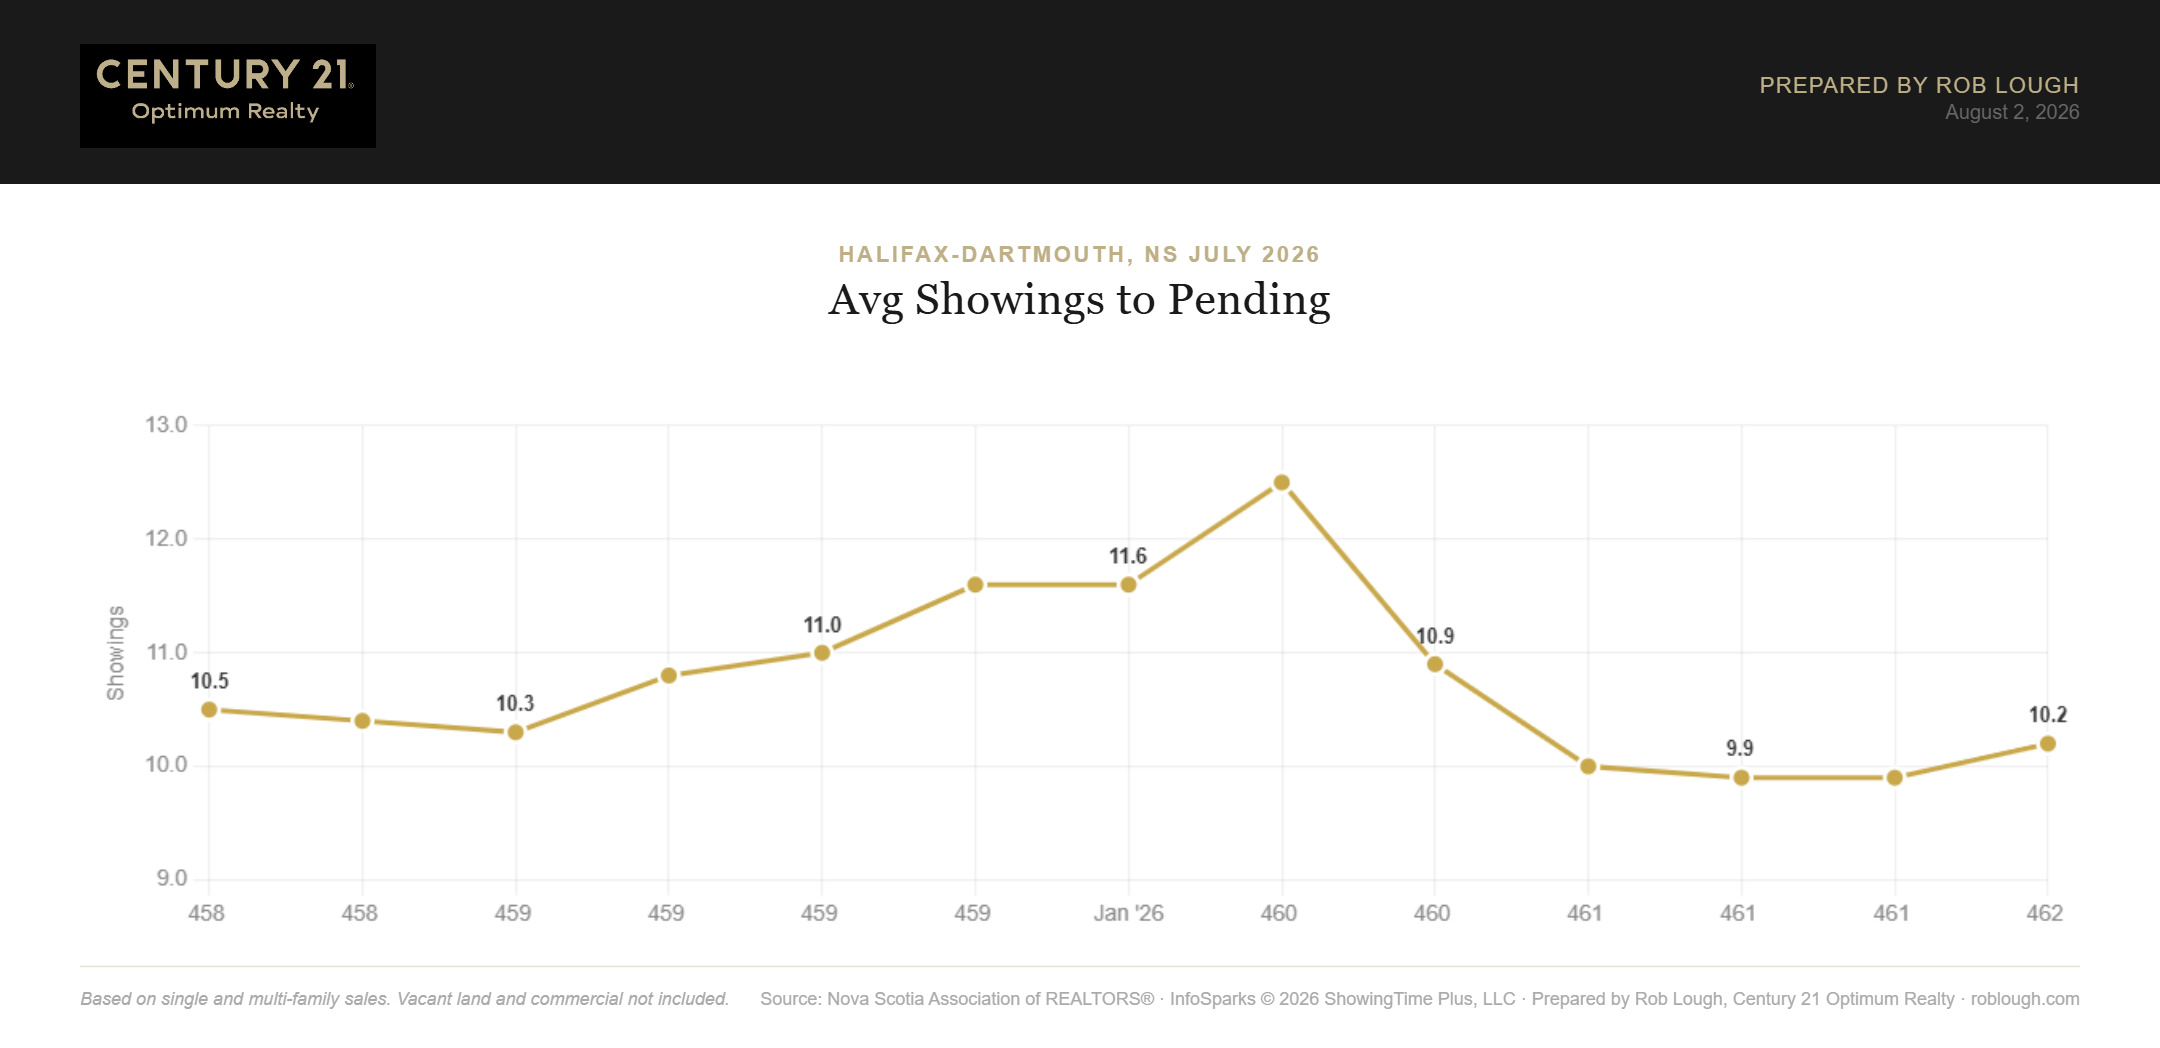
Halifax-Dartmouth Real Estate Market Stats July 2026 average number of showings to pending
What This Means for Buyers and Sellers
For buyers: July 2026 is the strongest position buyers have had in Halifax-Dartmouth in several years. There are 1,504 homes to choose from, 304 more than last July, sellers are accepting 3.1% below original asking on average, and with pending sales down sharply, competition for any given listing is thinner than it’s been all year. Before you move, make sure your financing is in order: Why Getting Pre-Approved Is the Smartest First Step walks through why that matters, and Closing Costs When Buying in Nova Scotia will keep your budget free of surprises at the finish line. With more inventory comes more time for due diligence, What a Home Inspector Looks for in Halifax Houses is worth reading before you write an offer.
For sellers: The fundamentals are still on your side, average price is up year-over-year, price per square foot is up, and homes are selling in about five weeks. But 465 sales against 1,504 listings changes the math on pricing. Buyers now have real alternatives to your home, and the sale-to-original-list ratio shows what happens when a listing starts too high. Accurate pricing and strong presentation out of the gate matter more this month than they have at any point in this cycle. A free home valuation is the right place to start.
The Bigger Picture
Halifax-Dartmouth continues to hold up better than many Canadian markets through the 2025–2026 cycle, even as local conditions move steadily toward balance. For a ground-level look at what Nova Scotians are experiencing on affordability, see Nova Scotians Say Housing Is Unaffordable, and for how markets across the country are diverging, Canadian Housing Markets Aren’t Moving in Sync puts Halifax’s numbers in national context.
Wondering how Halifax-Dartmouth compares to the province as a whole? Provincially, Nova Scotia reached 5.5 months of supply in July versus Halifax-Dartmouth’s 3.9, the metro area remains meaningfully tighter than the province at large. See the Nova Scotia Market Stats for July 2026 for the full provincial picture.
Questions about what this data means for your specific situation? Reach out directly I’m happy to talk through the numbers.
Frequently Asked Questions
Is Halifax-Dartmouth a buyer’s or seller’s market in July 2026? With 3.9 months of supply, Halifax-Dartmouth sits just below the 4–6 month range that defines a balanced market. Technically it remains a seller’s market, but only marginally, inventory is up 25.3% year-over-year and this is the closest to balance the metro has come in this cycle.
How much did homes sell for in Halifax-Dartmouth in July 2026? The average sales price was $599,299, up 0.9% from July 2025, and the median sales price was $550,000, down 0.9% year-over-year. Both were down from June.
How long does it take to sell a home in Halifax-Dartmouth right now? Homes averaged 36 days on market in July 2026, up from 32 days in June and 29 days a year ago, still fast by historical standards, but roughly a week slower than last summer.
How much inventory is available in Halifax-Dartmouth right now? Active inventory reached 1,504 homes for sale in July 2026, a 13-month high and up 25.3% from July 2025’s 1,200 listings.
Are Halifax home prices falling? Not on a per-square-foot basis. Average price per square foot on total living area was $329 in July 2026, up 2.2% from a year ago. Softer average and median prices reflect a shift in the mix of homes selling rather than a broad decline in value.
Are buyers gaining negotiating power in Halifax-Dartmouth? Yes. The sale-to-original-list price ratio was 96.9% in July 2026, down from 98.3% a year ago, and inventory is up more than 25%. Buyers have both more choice and more room to negotiate than they did last summer.
What do falling pending sales mean for the Halifax market? Pending sales dropped to 425 in July, down 19.5% from June. Because pending sales typically close within 30 to 60 days, this points to softer closed-sales numbers in August and September than the summer has delivered so far.
Written by Rob Lough | Broker/Owner, Century 21 Optimum Realty | Halifax, Nova Scotia. Rob Lough is a licensed REALTOR® and Broker/Owner with 25 years of experience in the Halifax-Dartmouth and Nova Scotia markets, including five years as a certified Home Inspector. Serving Halifax Regional Municipality, East Hants, and the Truro/District 104 corridor.
Data source: Nova Scotia Association of REALTORS®. Halifax-Dartmouth area, single and multi-family residential. Vacant land and commercial properties are not included.
Related Resources
- Halifax-Dartmouth Real Estate Market Stats: June 2026
- Halifax Dartmouth Condo Market Report for June 2026
- Halifax Dartmouth Condo Market Report July 2026
- Nova Scotia Market Stats for July 2026
- What a Home Inspector Looks for in Halifax Houses
- How to Price Your Home to Sell in Halifax
- Why Getting Pre-Approved Is the Smartest First Step
- Closing Costs When Buying in Nova Scotia
- Nova Scotians Say Housing Is Unaffordable
- Canadian Housing Markets Aren’t Moving in Sync
- Halifax-Dartmouth Real Estate Dashboard
- Sellers Net Proceeds Calculator
- Free Home Valuation — Halifax-Dartmouth
- Contact Rob Lough

